Burmese vs Immigrants from Latvia GED/Equivalency
COMPARE
Burmese
Immigrants from Latvia
GED/Equivalency
GED/Equivalency Comparison
Burmese
Immigrants from Latvia
88.3%
GED/EQUIVALENCY
99.7/ 100
METRIC RATING
38th/ 347
METRIC RANK
88.1%
GED/EQUIVALENCY
99.5/ 100
METRIC RATING
47th/ 347
METRIC RANK
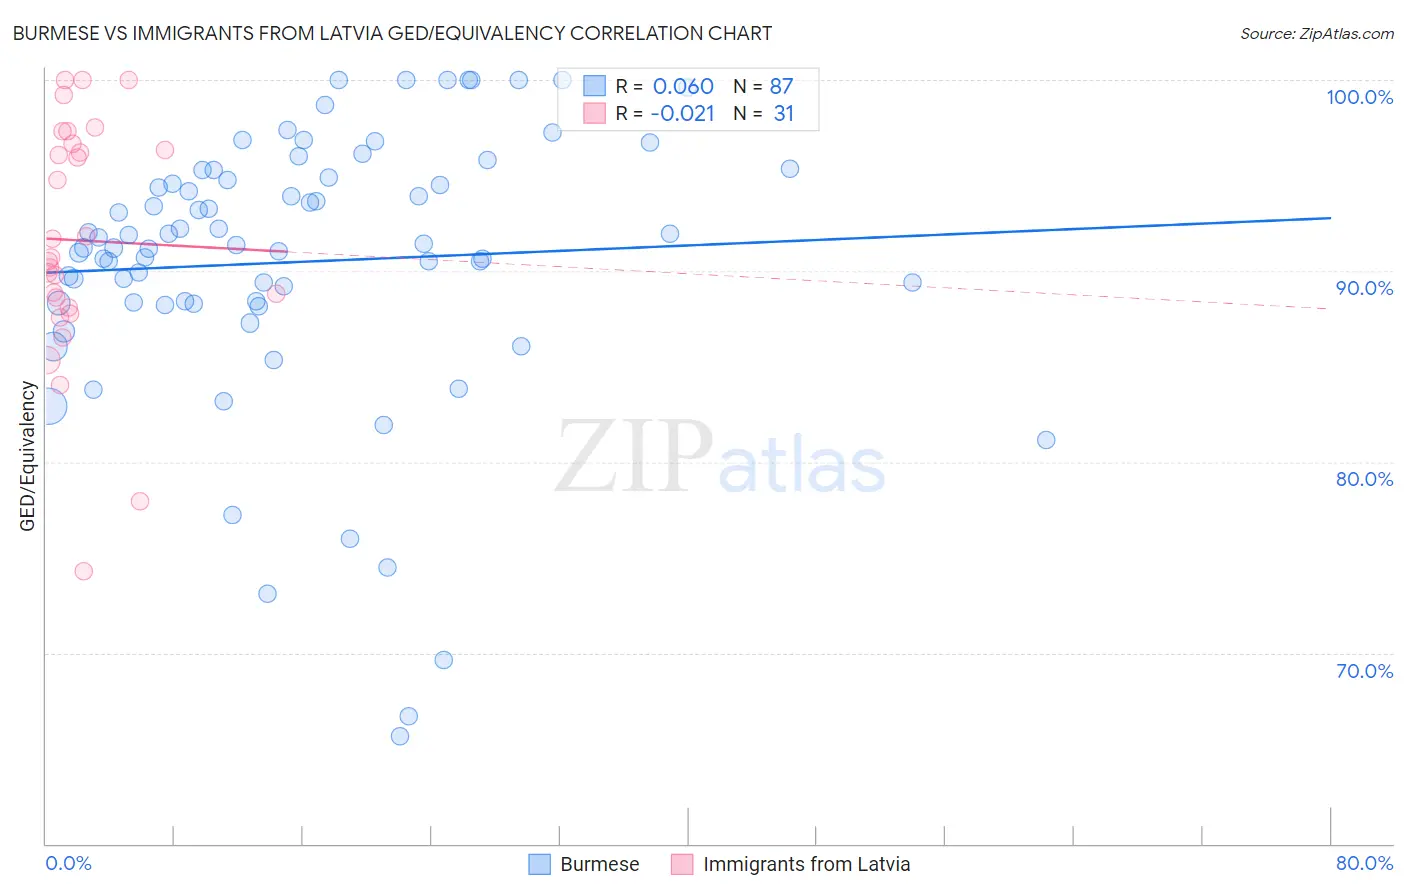
Burmese vs Immigrants from Latvia GED/Equivalency Correlation Chart
The statistical analysis conducted on geographies consisting of 465,408,087 people shows a slight positive correlation between the proportion of Burmese and percentage of population with at least ged/equivalency education in the United States with a correlation coefficient (R) of 0.060 and weighted average of 88.3%. Similarly, the statistical analysis conducted on geographies consisting of 113,735,345 people shows no correlation between the proportion of Immigrants from Latvia and percentage of population with at least ged/equivalency education in the United States with a correlation coefficient (R) of -0.021 and weighted average of 88.1%, a difference of 0.25%.
GED/Equivalency Correlation Summary
| Measurement | Burmese | Immigrants from Latvia |
| Minimum | 65.6% | 74.3% |
| Maximum | 100.0% | 100.0% |
| Range | 34.4% | 25.7% |
| Mean | 90.5% | 91.6% |
| Median | 91.4% | 90.7% |
| Interquartile 25% (IQ1) | 88.3% | 88.1% |
| Interquartile 75% (IQ3) | 94.9% | 96.7% |
| Interquartile Range (IQR) | 6.6% | 8.5% |
| Standard Deviation (Sample) | 7.2% | 6.3% |
| Standard Deviation (Population) | 7.1% | 6.2% |
Demographics Similar to Burmese and Immigrants from Latvia by GED/Equivalency
In terms of ged/equivalency, the demographic groups most similar to Burmese are Immigrants from Austria (88.3%, a difference of 0.030%), Immigrants from Belgium (88.3%, a difference of 0.060%), Immigrants from South Central Asia (88.4%, a difference of 0.080%), Immigrants from Israel (88.2%, a difference of 0.090%), and Immigrants from Sweden (88.4%, a difference of 0.10%). Similarly, the demographic groups most similar to Immigrants from Latvia are Immigrants from Switzerland (88.1%, a difference of 0.010%), Greek (88.1%, a difference of 0.010%), Australian (88.1%, a difference of 0.020%), Czech (88.1%, a difference of 0.030%), and Immigrants from Korea (88.1%, a difference of 0.030%).
| Demographics | Rating | Rank | GED/Equivalency |
| Danes | 99.8 /100 | #32 | Exceptional 88.4% |
| Immigrants | Sweden | 99.7 /100 | #33 | Exceptional 88.4% |
| Immigrants | Japan | 99.7 /100 | #34 | Exceptional 88.4% |
| Immigrants | South Central Asia | 99.7 /100 | #35 | Exceptional 88.4% |
| Immigrants | Belgium | 99.7 /100 | #36 | Exceptional 88.3% |
| Immigrants | Austria | 99.7 /100 | #37 | Exceptional 88.3% |
| Burmese | 99.7 /100 | #38 | Exceptional 88.3% |
| Immigrants | Israel | 99.6 /100 | #39 | Exceptional 88.2% |
| Italians | 99.6 /100 | #40 | Exceptional 88.2% |
| Finns | 99.6 /100 | #41 | Exceptional 88.2% |
| Cambodians | 99.6 /100 | #42 | Exceptional 88.2% |
| Immigrants | Scotland | 99.6 /100 | #43 | Exceptional 88.2% |
| Macedonians | 99.5 /100 | #44 | Exceptional 88.1% |
| Czechs | 99.5 /100 | #45 | Exceptional 88.1% |
| Immigrants | Switzerland | 99.5 /100 | #46 | Exceptional 88.1% |
| Immigrants | Latvia | 99.5 /100 | #47 | Exceptional 88.1% |
| Greeks | 99.5 /100 | #48 | Exceptional 88.1% |
| Australians | 99.5 /100 | #49 | Exceptional 88.1% |
| Immigrants | Korea | 99.5 /100 | #50 | Exceptional 88.1% |
| Immigrants | Netherlands | 99.4 /100 | #51 | Exceptional 88.0% |
| Zimbabweans | 99.4 /100 | #52 | Exceptional 88.0% |