Russian vs Immigrants from Latvia Family Households
COMPARE
Russian
Immigrants from Latvia
Family Households
Family Households Comparison
Russians
Immigrants from Latvia
63.4%
FAMILY HOUSEHOLDS
1.4/ 100
METRIC RATING
249th/ 347
METRIC RANK
62.0%
FAMILY HOUSEHOLDS
0.0/ 100
METRIC RATING
312th/ 347
METRIC RANK
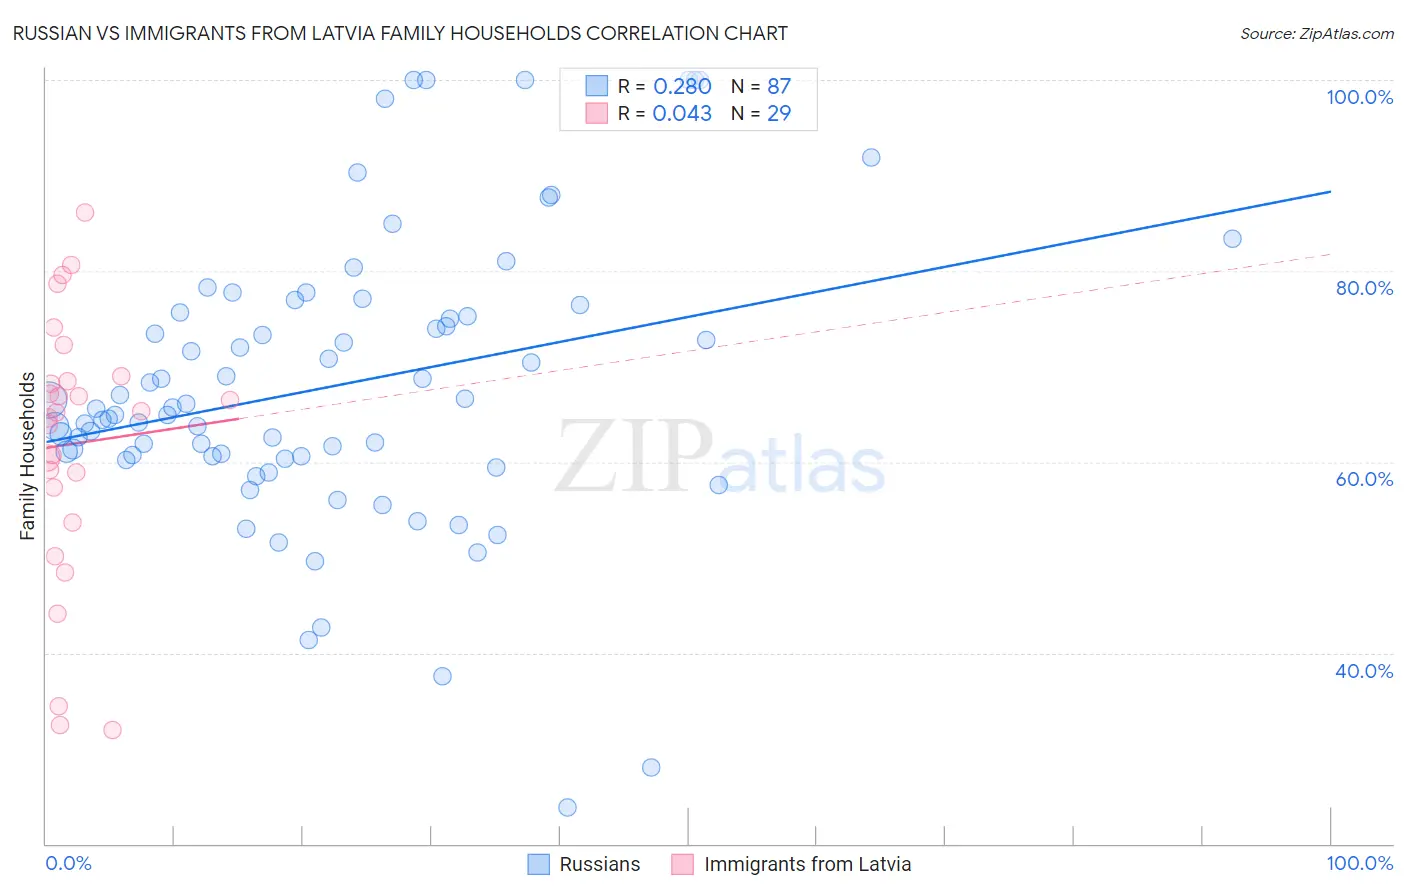
Russian vs Immigrants from Latvia Family Households Correlation Chart
The statistical analysis conducted on geographies consisting of 511,741,989 people shows a weak positive correlation between the proportion of Russians and percentage of family households in the United States with a correlation coefficient (R) of 0.280 and weighted average of 63.4%. Similarly, the statistical analysis conducted on geographies consisting of 113,726,313 people shows no correlation between the proportion of Immigrants from Latvia and percentage of family households in the United States with a correlation coefficient (R) of 0.043 and weighted average of 62.0%, a difference of 2.3%.
Family Households Correlation Summary
| Measurement | Russian | Immigrants from Latvia |
| Minimum | 23.8% | 31.9% |
| Maximum | 100.0% | 86.2% |
| Range | 76.2% | 54.2% |
| Mean | 68.0% | 61.9% |
| Median | 65.5% | 65.2% |
| Interquartile 25% (IQ1) | 60.6% | 55.5% |
| Interquartile 75% (IQ3) | 75.7% | 68.7% |
| Interquartile Range (IQR) | 15.1% | 13.2% |
| Standard Deviation (Sample) | 15.2% | 13.8% |
| Standard Deviation (Population) | 15.1% | 13.5% |
Similar Demographics by Family Households
Demographics Similar to Russians by Family Households
In terms of family households, the demographic groups most similar to Russians are Dominican (63.4%, a difference of 0.010%), Immigrants from Japan (63.4%, a difference of 0.010%), Immigrants from Uzbekistan (63.4%, a difference of 0.020%), Immigrants from Ghana (63.4%, a difference of 0.030%), and Eastern European (63.4%, a difference of 0.050%).
| Demographics | Rating | Rank | Family Households |
| Immigrants | Israel | 1.8 /100 | #242 | Tragic 63.4% |
| Immigrants | Czechoslovakia | 1.8 /100 | #243 | Tragic 63.4% |
| Eastern Europeans | 1.6 /100 | #244 | Tragic 63.4% |
| Immigrants | Dominica | 1.6 /100 | #245 | Tragic 63.4% |
| Immigrants | Ghana | 1.6 /100 | #246 | Tragic 63.4% |
| Immigrants | Uzbekistan | 1.5 /100 | #247 | Tragic 63.4% |
| Dominicans | 1.5 /100 | #248 | Tragic 63.4% |
| Russians | 1.4 /100 | #249 | Tragic 63.4% |
| Immigrants | Japan | 1.4 /100 | #250 | Tragic 63.4% |
| Taiwanese | 1.2 /100 | #251 | Tragic 63.3% |
| Bahamians | 1.1 /100 | #252 | Tragic 63.3% |
| Immigrants | Dominican Republic | 1.0 /100 | #253 | Tragic 63.3% |
| Slovaks | 1.0 /100 | #254 | Tragic 63.3% |
| Potawatomi | 1.0 /100 | #255 | Tragic 63.3% |
| Luxembourgers | 0.9 /100 | #256 | Tragic 63.3% |
Demographics Similar to Immigrants from Latvia by Family Households
In terms of family households, the demographic groups most similar to Immigrants from Latvia are Liberian (62.0%, a difference of 0.010%), Immigrants from Morocco (62.0%, a difference of 0.050%), Immigrants from Cabo Verde (61.9%, a difference of 0.060%), Immigrants from Liberia (62.0%, a difference of 0.080%), and Moroccan (61.9%, a difference of 0.10%).
| Demographics | Rating | Rank | Family Households |
| Bermudans | 0.0 /100 | #305 | Tragic 62.2% |
| Africans | 0.0 /100 | #306 | Tragic 62.1% |
| Immigrants | Norway | 0.0 /100 | #307 | Tragic 62.1% |
| Chippewa | 0.0 /100 | #308 | Tragic 62.1% |
| Sub-Saharan Africans | 0.0 /100 | #309 | Tragic 62.1% |
| Immigrants | Liberia | 0.0 /100 | #310 | Tragic 62.0% |
| Immigrants | Morocco | 0.0 /100 | #311 | Tragic 62.0% |
| Immigrants | Latvia | 0.0 /100 | #312 | Tragic 62.0% |
| Liberians | 0.0 /100 | #313 | Tragic 62.0% |
| Immigrants | Cabo Verde | 0.0 /100 | #314 | Tragic 61.9% |
| Moroccans | 0.0 /100 | #315 | Tragic 61.9% |
| Immigrants | Middle Africa | 0.0 /100 | #316 | Tragic 61.9% |
| Immigrants | Bosnia and Herzegovina | 0.0 /100 | #317 | Tragic 61.9% |
| Alaskan Athabascans | 0.0 /100 | #318 | Tragic 61.8% |
| Cape Verdeans | 0.0 /100 | #319 | Tragic 61.8% |