Blackfeet vs Immigrants from Latvia GED/Equivalency
COMPARE
Blackfeet
Immigrants from Latvia
GED/Equivalency
GED/Equivalency Comparison
Blackfeet
Immigrants from Latvia
83.8%
GED/EQUIVALENCY
1.1/ 100
METRIC RATING
248th/ 347
METRIC RANK
88.1%
GED/EQUIVALENCY
99.5/ 100
METRIC RATING
47th/ 347
METRIC RANK
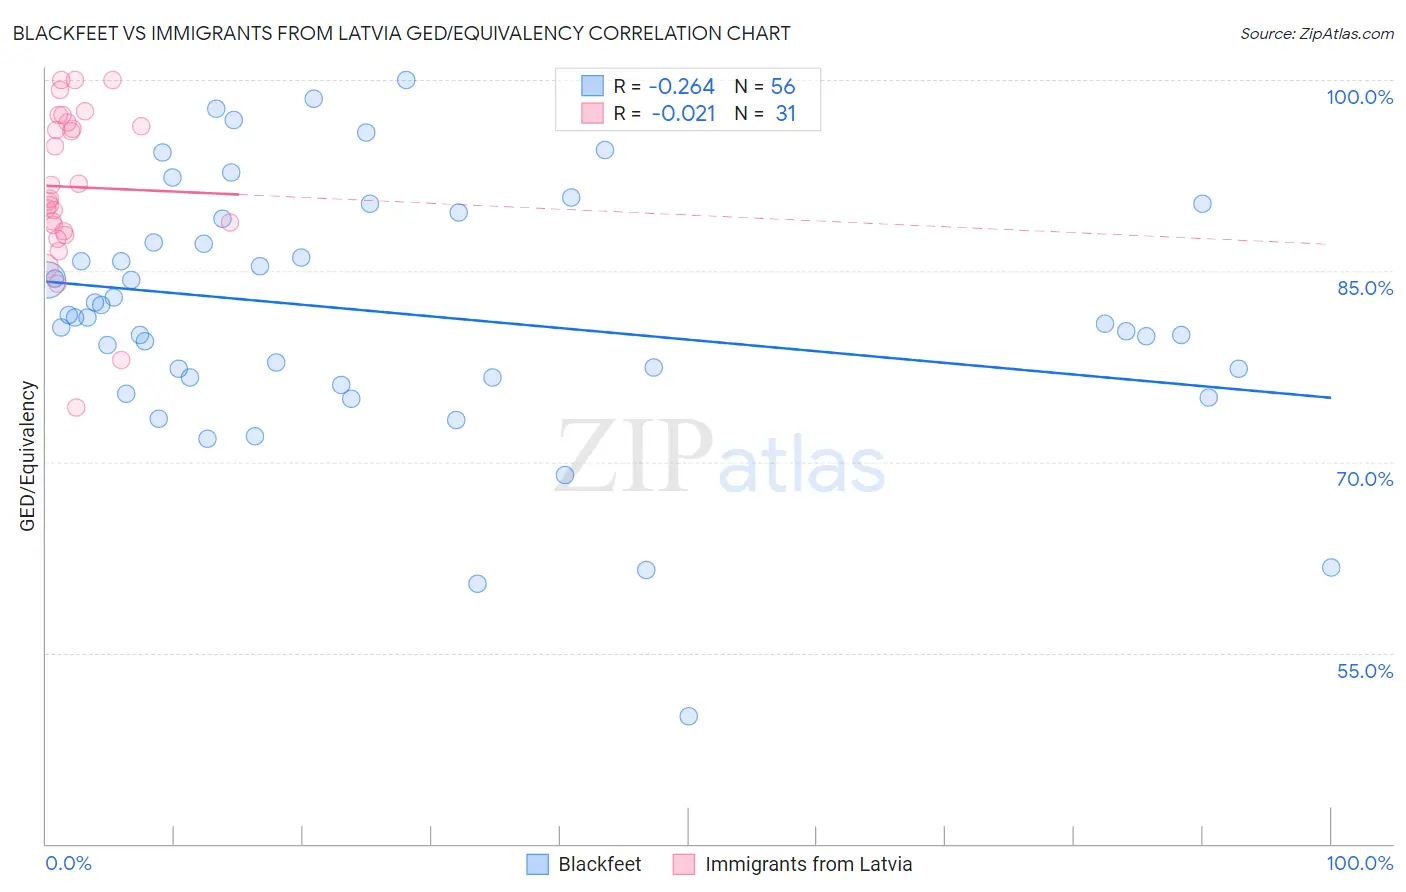
Blackfeet vs Immigrants from Latvia GED/Equivalency Correlation Chart
The statistical analysis conducted on geographies consisting of 309,582,068 people shows a weak negative correlation between the proportion of Blackfeet and percentage of population with at least ged/equivalency education in the United States with a correlation coefficient (R) of -0.264 and weighted average of 83.8%. Similarly, the statistical analysis conducted on geographies consisting of 113,735,345 people shows no correlation between the proportion of Immigrants from Latvia and percentage of population with at least ged/equivalency education in the United States with a correlation coefficient (R) of -0.021 and weighted average of 88.1%, a difference of 5.1%.
GED/Equivalency Correlation Summary
| Measurement | Blackfeet | Immigrants from Latvia |
| Minimum | 50.0% | 74.3% |
| Maximum | 100.0% | 100.0% |
| Range | 50.0% | 25.7% |
| Mean | 81.7% | 91.6% |
| Median | 81.4% | 90.7% |
| Interquartile 25% (IQ1) | 76.6% | 88.1% |
| Interquartile 75% (IQ3) | 88.2% | 96.7% |
| Interquartile Range (IQR) | 11.6% | 8.5% |
| Standard Deviation (Sample) | 9.9% | 6.3% |
| Standard Deviation (Population) | 9.8% | 6.2% |
Similar Demographics by GED/Equivalency
Demographics Similar to Blackfeet by GED/Equivalency
In terms of ged/equivalency, the demographic groups most similar to Blackfeet are Crow (83.8%, a difference of 0.010%), Immigrants from Western Africa (83.8%, a difference of 0.020%), Shoshone (83.7%, a difference of 0.020%), Chickasaw (83.8%, a difference of 0.050%), and Immigrants from Senegal (83.8%, a difference of 0.070%).
| Demographics | Rating | Rank | GED/Equivalency |
| Senegalese | 1.9 /100 | #241 | Tragic 84.0% |
| Sri Lankans | 1.9 /100 | #242 | Tragic 84.0% |
| Cherokee | 1.3 /100 | #243 | Tragic 83.9% |
| Immigrants | Ghana | 1.3 /100 | #244 | Tragic 83.9% |
| Immigrants | Senegal | 1.2 /100 | #245 | Tragic 83.8% |
| Chickasaw | 1.2 /100 | #246 | Tragic 83.8% |
| Immigrants | Western Africa | 1.1 /100 | #247 | Tragic 83.8% |
| Blackfeet | 1.1 /100 | #248 | Tragic 83.8% |
| Crow | 1.1 /100 | #249 | Tragic 83.8% |
| Shoshone | 1.0 /100 | #250 | Tragic 83.7% |
| Spanish Americans | 0.8 /100 | #251 | Tragic 83.6% |
| Bahamians | 0.8 /100 | #252 | Tragic 83.6% |
| Comanche | 0.7 /100 | #253 | Tragic 83.6% |
| Creek | 0.7 /100 | #254 | Tragic 83.6% |
| Colville | 0.5 /100 | #255 | Tragic 83.4% |
Demographics Similar to Immigrants from Latvia by GED/Equivalency
In terms of ged/equivalency, the demographic groups most similar to Immigrants from Latvia are Immigrants from Switzerland (88.1%, a difference of 0.010%), Greek (88.1%, a difference of 0.010%), Australian (88.1%, a difference of 0.020%), Czech (88.1%, a difference of 0.030%), and Immigrants from Korea (88.1%, a difference of 0.030%).
| Demographics | Rating | Rank | GED/Equivalency |
| Italians | 99.6 /100 | #40 | Exceptional 88.2% |
| Finns | 99.6 /100 | #41 | Exceptional 88.2% |
| Cambodians | 99.6 /100 | #42 | Exceptional 88.2% |
| Immigrants | Scotland | 99.6 /100 | #43 | Exceptional 88.2% |
| Macedonians | 99.5 /100 | #44 | Exceptional 88.1% |
| Czechs | 99.5 /100 | #45 | Exceptional 88.1% |
| Immigrants | Switzerland | 99.5 /100 | #46 | Exceptional 88.1% |
| Immigrants | Latvia | 99.5 /100 | #47 | Exceptional 88.1% |
| Greeks | 99.5 /100 | #48 | Exceptional 88.1% |
| Australians | 99.5 /100 | #49 | Exceptional 88.1% |
| Immigrants | Korea | 99.5 /100 | #50 | Exceptional 88.1% |
| Immigrants | Netherlands | 99.4 /100 | #51 | Exceptional 88.0% |
| Zimbabweans | 99.4 /100 | #52 | Exceptional 88.0% |
| Immigrants | South Africa | 99.4 /100 | #53 | Exceptional 88.0% |
| Soviet Union | 99.4 /100 | #54 | Exceptional 88.0% |