Russian vs Immigrants from Peru GED/Equivalency
COMPARE
Russian
Immigrants from Peru
GED/Equivalency
GED/Equivalency Comparison
Russians
Immigrants from Peru
88.6%
GED/EQUIVALENCY
99.8/ 100
METRIC RATING
23rd/ 347
METRIC RANK
84.2%
GED/EQUIVALENCY
2.7/ 100
METRIC RATING
238th/ 347
METRIC RANK
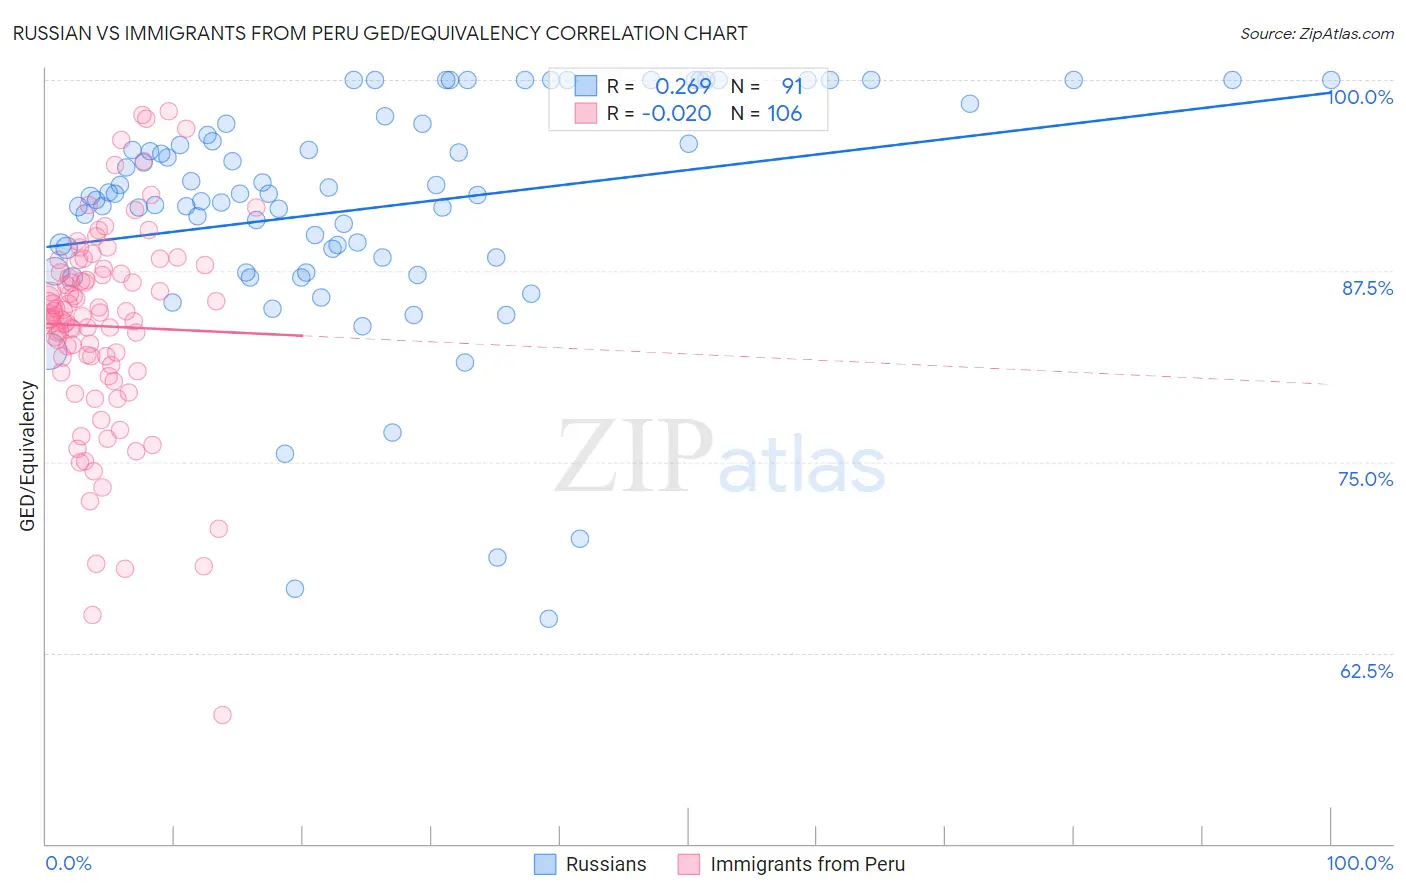
Russian vs Immigrants from Peru GED/Equivalency Correlation Chart
The statistical analysis conducted on geographies consisting of 512,259,122 people shows a weak positive correlation between the proportion of Russians and percentage of population with at least ged/equivalency education in the United States with a correlation coefficient (R) of 0.269 and weighted average of 88.6%. Similarly, the statistical analysis conducted on geographies consisting of 328,860,880 people shows no correlation between the proportion of Immigrants from Peru and percentage of population with at least ged/equivalency education in the United States with a correlation coefficient (R) of -0.020 and weighted average of 84.2%, a difference of 5.2%.
GED/Equivalency Correlation Summary
| Measurement | Russian | Immigrants from Peru |
| Minimum | 64.7% | 58.5% |
| Maximum | 100.0% | 97.9% |
| Range | 35.3% | 39.5% |
| Mean | 91.6% | 83.9% |
| Median | 92.5% | 84.6% |
| Interquartile 25% (IQ1) | 88.3% | 81.3% |
| Interquartile 75% (IQ3) | 97.1% | 87.4% |
| Interquartile Range (IQR) | 8.8% | 6.1% |
| Standard Deviation (Sample) | 7.6% | 6.8% |
| Standard Deviation (Population) | 7.5% | 6.8% |
Similar Demographics by GED/Equivalency
Demographics Similar to Russians by GED/Equivalency
In terms of ged/equivalency, the demographic groups most similar to Russians are Slovak (88.6%, a difference of 0.0%), Estonian (88.6%, a difference of 0.0%), Immigrants from Australia (88.6%, a difference of 0.010%), Immigrants from Ireland (88.6%, a difference of 0.020%), and Luxembourger (88.6%, a difference of 0.030%).
| Demographics | Rating | Rank | GED/Equivalency |
| Immigrants | Taiwan | 99.9 /100 | #16 | Exceptional 88.8% |
| Croatians | 99.9 /100 | #17 | Exceptional 88.8% |
| Slovenes | 99.9 /100 | #18 | Exceptional 88.8% |
| Swedes | 99.9 /100 | #19 | Exceptional 88.8% |
| Maltese | 99.9 /100 | #20 | Exceptional 88.6% |
| Luxembourgers | 99.8 /100 | #21 | Exceptional 88.6% |
| Immigrants | Ireland | 99.8 /100 | #22 | Exceptional 88.6% |
| Russians | 99.8 /100 | #23 | Exceptional 88.6% |
| Slovaks | 99.8 /100 | #24 | Exceptional 88.6% |
| Estonians | 99.8 /100 | #25 | Exceptional 88.6% |
| Immigrants | Australia | 99.8 /100 | #26 | Exceptional 88.6% |
| Immigrants | Lithuania | 99.8 /100 | #27 | Exceptional 88.6% |
| Immigrants | Northern Europe | 99.8 /100 | #28 | Exceptional 88.5% |
| Poles | 99.8 /100 | #29 | Exceptional 88.5% |
| Turks | 99.8 /100 | #30 | Exceptional 88.5% |
Demographics Similar to Immigrants from Peru by GED/Equivalency
In terms of ged/equivalency, the demographic groups most similar to Immigrants from Peru are Immigrants from Bahamas (84.2%, a difference of 0.030%), Immigrants from South Eastern Asia (84.1%, a difference of 0.040%), Subsaharan African (84.2%, a difference of 0.060%), Ghanaian (84.3%, a difference of 0.13%), and Immigrants from Eritrea (84.3%, a difference of 0.13%).
| Demographics | Rating | Rank | GED/Equivalency |
| Immigrants | Middle Africa | 4.3 /100 | #231 | Tragic 84.4% |
| Immigrants | South America | 4.2 /100 | #232 | Tragic 84.4% |
| Immigrants | Panama | 4.1 /100 | #233 | Tragic 84.4% |
| Immigrants | Nigeria | 3.6 /100 | #234 | Tragic 84.3% |
| Ghanaians | 3.5 /100 | #235 | Tragic 84.3% |
| Immigrants | Eritrea | 3.5 /100 | #236 | Tragic 84.3% |
| Sub-Saharan Africans | 3.0 /100 | #237 | Tragic 84.2% |
| Immigrants | Peru | 2.7 /100 | #238 | Tragic 84.2% |
| Immigrants | Bahamas | 2.6 /100 | #239 | Tragic 84.2% |
| Immigrants | South Eastern Asia | 2.5 /100 | #240 | Tragic 84.1% |
| Senegalese | 1.9 /100 | #241 | Tragic 84.0% |
| Sri Lankans | 1.9 /100 | #242 | Tragic 84.0% |
| Cherokee | 1.3 /100 | #243 | Tragic 83.9% |
| Immigrants | Ghana | 1.3 /100 | #244 | Tragic 83.9% |
| Immigrants | Senegal | 1.2 /100 | #245 | Tragic 83.8% |