Jordanian vs Immigrants from Latvia GED/Equivalency
COMPARE
Jordanian
Immigrants from Latvia
GED/Equivalency
GED/Equivalency Comparison
Jordanians
Immigrants from Latvia
87.2%
GED/EQUIVALENCY
96.1/ 100
METRIC RATING
103rd/ 347
METRIC RANK
88.1%
GED/EQUIVALENCY
99.5/ 100
METRIC RATING
47th/ 347
METRIC RANK
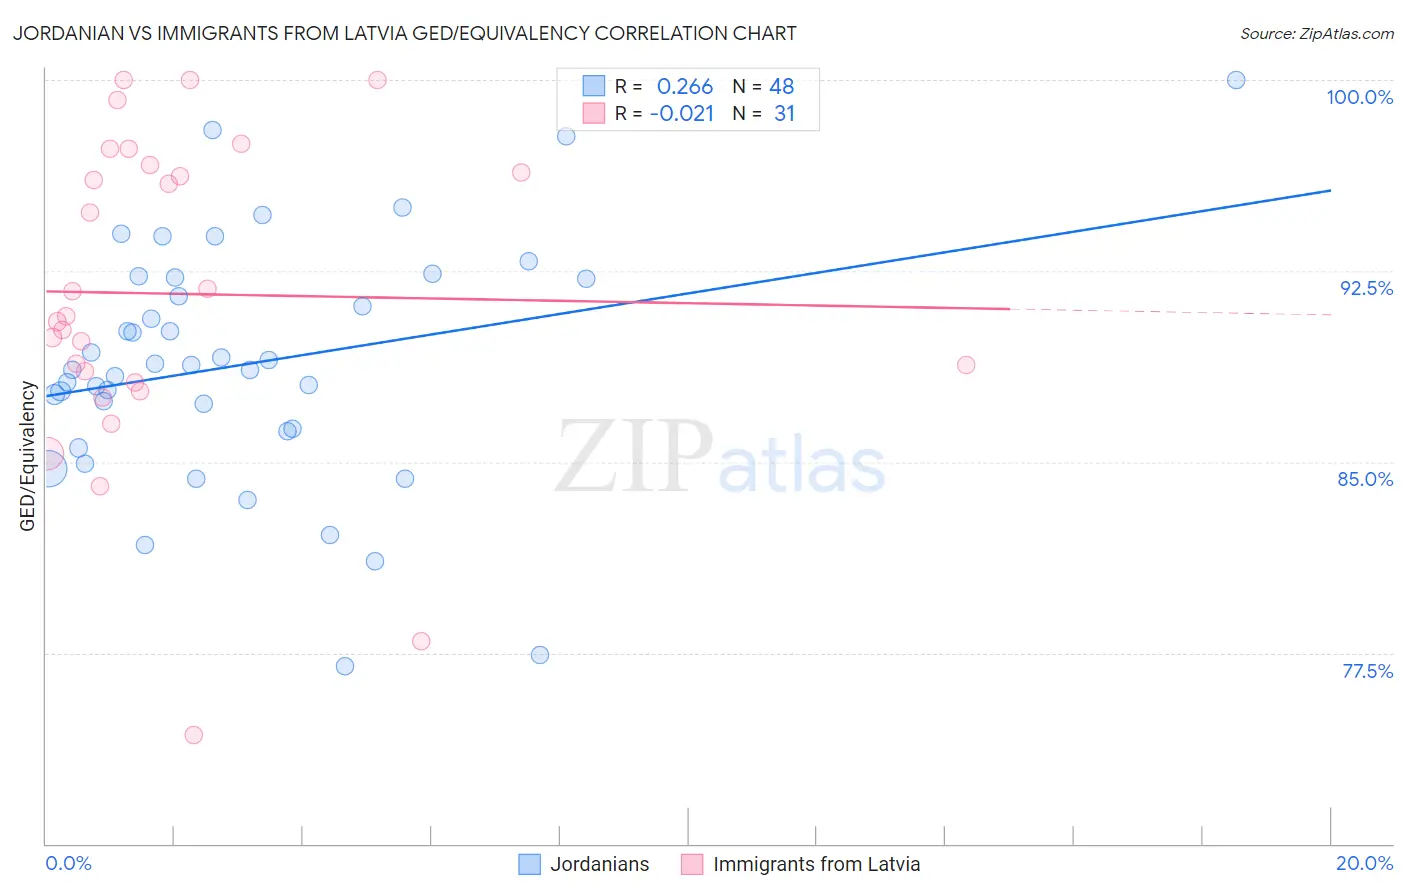
Jordanian vs Immigrants from Latvia GED/Equivalency Correlation Chart
The statistical analysis conducted on geographies consisting of 166,422,962 people shows a weak positive correlation between the proportion of Jordanians and percentage of population with at least ged/equivalency education in the United States with a correlation coefficient (R) of 0.266 and weighted average of 87.2%. Similarly, the statistical analysis conducted on geographies consisting of 113,735,345 people shows no correlation between the proportion of Immigrants from Latvia and percentage of population with at least ged/equivalency education in the United States with a correlation coefficient (R) of -0.021 and weighted average of 88.1%, a difference of 1.0%.
GED/Equivalency Correlation Summary
| Measurement | Jordanian | Immigrants from Latvia |
| Minimum | 77.0% | 74.3% |
| Maximum | 100.0% | 100.0% |
| Range | 23.0% | 25.7% |
| Mean | 88.8% | 91.6% |
| Median | 88.7% | 90.7% |
| Interquartile 25% (IQ1) | 86.3% | 88.1% |
| Interquartile 75% (IQ3) | 92.2% | 96.7% |
| Interquartile Range (IQR) | 6.0% | 8.5% |
| Standard Deviation (Sample) | 4.8% | 6.3% |
| Standard Deviation (Population) | 4.8% | 6.2% |
Similar Demographics by GED/Equivalency
Demographics Similar to Jordanians by GED/Equivalency
In terms of ged/equivalency, the demographic groups most similar to Jordanians are Lebanese (87.2%, a difference of 0.010%), Immigrants from Hungary (87.2%, a difference of 0.010%), Indian (Asian) (87.1%, a difference of 0.020%), Immigrants from Zimbabwe (87.1%, a difference of 0.040%), and Icelander (87.1%, a difference of 0.050%).
| Demographics | Rating | Rank | GED/Equivalency |
| Czechoslovakians | 97.6 /100 | #96 | Exceptional 87.4% |
| Immigrants | Western Europe | 97.3 /100 | #97 | Exceptional 87.3% |
| Immigrants | Croatia | 96.9 /100 | #98 | Exceptional 87.3% |
| Immigrants | Belarus | 96.9 /100 | #99 | Exceptional 87.3% |
| Palestinians | 96.8 /100 | #100 | Exceptional 87.3% |
| Syrians | 96.6 /100 | #101 | Exceptional 87.2% |
| Lebanese | 96.2 /100 | #102 | Exceptional 87.2% |
| Jordanians | 96.1 /100 | #103 | Exceptional 87.2% |
| Immigrants | Hungary | 96.0 /100 | #104 | Exceptional 87.2% |
| Indians (Asian) | 95.9 /100 | #105 | Exceptional 87.1% |
| Immigrants | Zimbabwe | 95.8 /100 | #106 | Exceptional 87.1% |
| Icelanders | 95.7 /100 | #107 | Exceptional 87.1% |
| Canadians | 95.6 /100 | #108 | Exceptional 87.1% |
| Immigrants | Eastern Europe | 95.5 /100 | #109 | Exceptional 87.1% |
| Egyptians | 95.3 /100 | #110 | Exceptional 87.1% |
Demographics Similar to Immigrants from Latvia by GED/Equivalency
In terms of ged/equivalency, the demographic groups most similar to Immigrants from Latvia are Immigrants from Switzerland (88.1%, a difference of 0.010%), Greek (88.1%, a difference of 0.010%), Australian (88.1%, a difference of 0.020%), Czech (88.1%, a difference of 0.030%), and Immigrants from Korea (88.1%, a difference of 0.030%).
| Demographics | Rating | Rank | GED/Equivalency |
| Italians | 99.6 /100 | #40 | Exceptional 88.2% |
| Finns | 99.6 /100 | #41 | Exceptional 88.2% |
| Cambodians | 99.6 /100 | #42 | Exceptional 88.2% |
| Immigrants | Scotland | 99.6 /100 | #43 | Exceptional 88.2% |
| Macedonians | 99.5 /100 | #44 | Exceptional 88.1% |
| Czechs | 99.5 /100 | #45 | Exceptional 88.1% |
| Immigrants | Switzerland | 99.5 /100 | #46 | Exceptional 88.1% |
| Immigrants | Latvia | 99.5 /100 | #47 | Exceptional 88.1% |
| Greeks | 99.5 /100 | #48 | Exceptional 88.1% |
| Australians | 99.5 /100 | #49 | Exceptional 88.1% |
| Immigrants | Korea | 99.5 /100 | #50 | Exceptional 88.1% |
| Immigrants | Netherlands | 99.4 /100 | #51 | Exceptional 88.0% |
| Zimbabweans | 99.4 /100 | #52 | Exceptional 88.0% |
| Immigrants | South Africa | 99.4 /100 | #53 | Exceptional 88.0% |
| Soviet Union | 99.4 /100 | #54 | Exceptional 88.0% |