Paraguayan vs Cheyenne GED/Equivalency
COMPARE
Paraguayan
Cheyenne
GED/Equivalency
GED/Equivalency Comparison
Paraguayans
Cheyenne
86.5%
GED/EQUIVALENCY
84.1/ 100
METRIC RATING
140th/ 347
METRIC RANK
82.7%
GED/EQUIVALENCY
0.1/ 100
METRIC RATING
280th/ 347
METRIC RANK
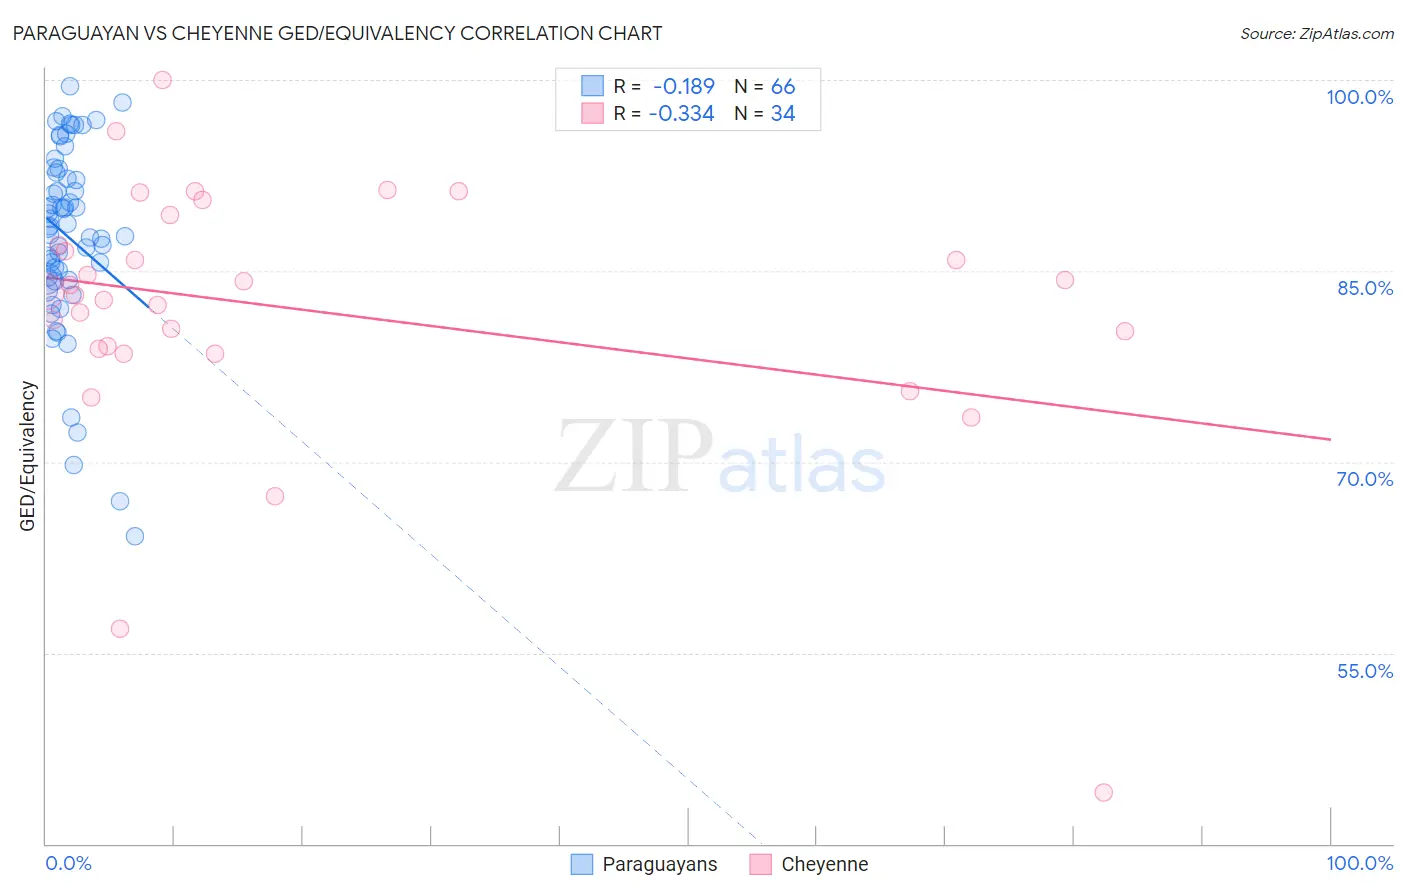
Paraguayan vs Cheyenne GED/Equivalency Correlation Chart
The statistical analysis conducted on geographies consisting of 95,114,201 people shows a poor negative correlation between the proportion of Paraguayans and percentage of population with at least ged/equivalency education in the United States with a correlation coefficient (R) of -0.189 and weighted average of 86.5%. Similarly, the statistical analysis conducted on geographies consisting of 80,719,411 people shows a mild negative correlation between the proportion of Cheyenne and percentage of population with at least ged/equivalency education in the United States with a correlation coefficient (R) of -0.334 and weighted average of 82.7%, a difference of 4.6%.
GED/Equivalency Correlation Summary
| Measurement | Paraguayan | Cheyenne |
| Minimum | 64.2% | 44.1% |
| Maximum | 99.5% | 100.0% |
| Range | 35.3% | 55.9% |
| Mean | 87.7% | 81.9% |
| Median | 88.5% | 83.3% |
| Interquartile 25% (IQ1) | 84.4% | 78.8% |
| Interquartile 75% (IQ3) | 92.7% | 87.0% |
| Interquartile Range (IQR) | 8.3% | 8.2% |
| Standard Deviation (Sample) | 7.3% | 10.4% |
| Standard Deviation (Population) | 7.3% | 10.3% |
Similar Demographics by GED/Equivalency
Demographics Similar to Paraguayans by GED/Equivalency
In terms of ged/equivalency, the demographic groups most similar to Paraguayans are Immigrants from Malaysia (86.5%, a difference of 0.030%), Laotian (86.5%, a difference of 0.030%), Immigrants from Indonesia (86.4%, a difference of 0.060%), Immigrants from Pakistan (86.4%, a difference of 0.060%), and Bolivian (86.4%, a difference of 0.070%).
| Demographics | Rating | Rank | GED/Equivalency |
| Tsimshian | 88.3 /100 | #133 | Excellent 86.6% |
| Albanians | 87.7 /100 | #134 | Excellent 86.6% |
| Immigrants | Asia | 87.4 /100 | #135 | Excellent 86.6% |
| Chileans | 86.9 /100 | #136 | Excellent 86.6% |
| Arabs | 86.7 /100 | #137 | Excellent 86.6% |
| Immigrants | Argentina | 86.5 /100 | #138 | Excellent 86.6% |
| Immigrants | Malaysia | 85.0 /100 | #139 | Excellent 86.5% |
| Paraguayans | 84.1 /100 | #140 | Excellent 86.5% |
| Laotians | 83.2 /100 | #141 | Excellent 86.5% |
| Immigrants | Indonesia | 82.4 /100 | #142 | Excellent 86.4% |
| Immigrants | Pakistan | 82.4 /100 | #143 | Excellent 86.4% |
| Bolivians | 82.1 /100 | #144 | Excellent 86.4% |
| Pakistanis | 80.4 /100 | #145 | Excellent 86.4% |
| Basques | 79.5 /100 | #146 | Good 86.4% |
| Immigrants | Northern Africa | 79.3 /100 | #147 | Good 86.3% |
Demographics Similar to Cheyenne by GED/Equivalency
In terms of ged/equivalency, the demographic groups most similar to Cheyenne are Immigrants from Laos (82.7%, a difference of 0.010%), Immigrants from Fiji (82.7%, a difference of 0.010%), Arapaho (82.8%, a difference of 0.050%), Black/African American (82.8%, a difference of 0.060%), and Seminole (82.8%, a difference of 0.090%).
| Demographics | Rating | Rank | GED/Equivalency |
| Pennsylvania Germans | 0.1 /100 | #273 | Tragic 82.9% |
| Immigrants | Trinidad and Tobago | 0.1 /100 | #274 | Tragic 82.8% |
| Seminole | 0.1 /100 | #275 | Tragic 82.8% |
| Blacks/African Americans | 0.1 /100 | #276 | Tragic 82.8% |
| Arapaho | 0.1 /100 | #277 | Tragic 82.8% |
| Immigrants | Laos | 0.1 /100 | #278 | Tragic 82.7% |
| Immigrants | Fiji | 0.1 /100 | #279 | Tragic 82.7% |
| Cheyenne | 0.1 /100 | #280 | Tragic 82.7% |
| Sioux | 0.1 /100 | #281 | Tragic 82.6% |
| Immigrants | Immigrants | 0.1 /100 | #282 | Tragic 82.6% |
| Indonesians | 0.1 /100 | #283 | Tragic 82.5% |
| Immigrants | Barbados | 0.1 /100 | #284 | Tragic 82.4% |
| Cajuns | 0.0 /100 | #285 | Tragic 82.4% |
| Immigrants | West Indies | 0.0 /100 | #286 | Tragic 82.4% |
| Japanese | 0.0 /100 | #287 | Tragic 82.4% |