Yuman vs Cheyenne GED/Equivalency
COMPARE
Yuman
Cheyenne
GED/Equivalency
GED/Equivalency Comparison
Yuman
Cheyenne
79.2%
GED/EQUIVALENCY
0.0/ 100
METRIC RATING
326th/ 347
METRIC RANK
82.7%
GED/EQUIVALENCY
0.1/ 100
METRIC RATING
280th/ 347
METRIC RANK
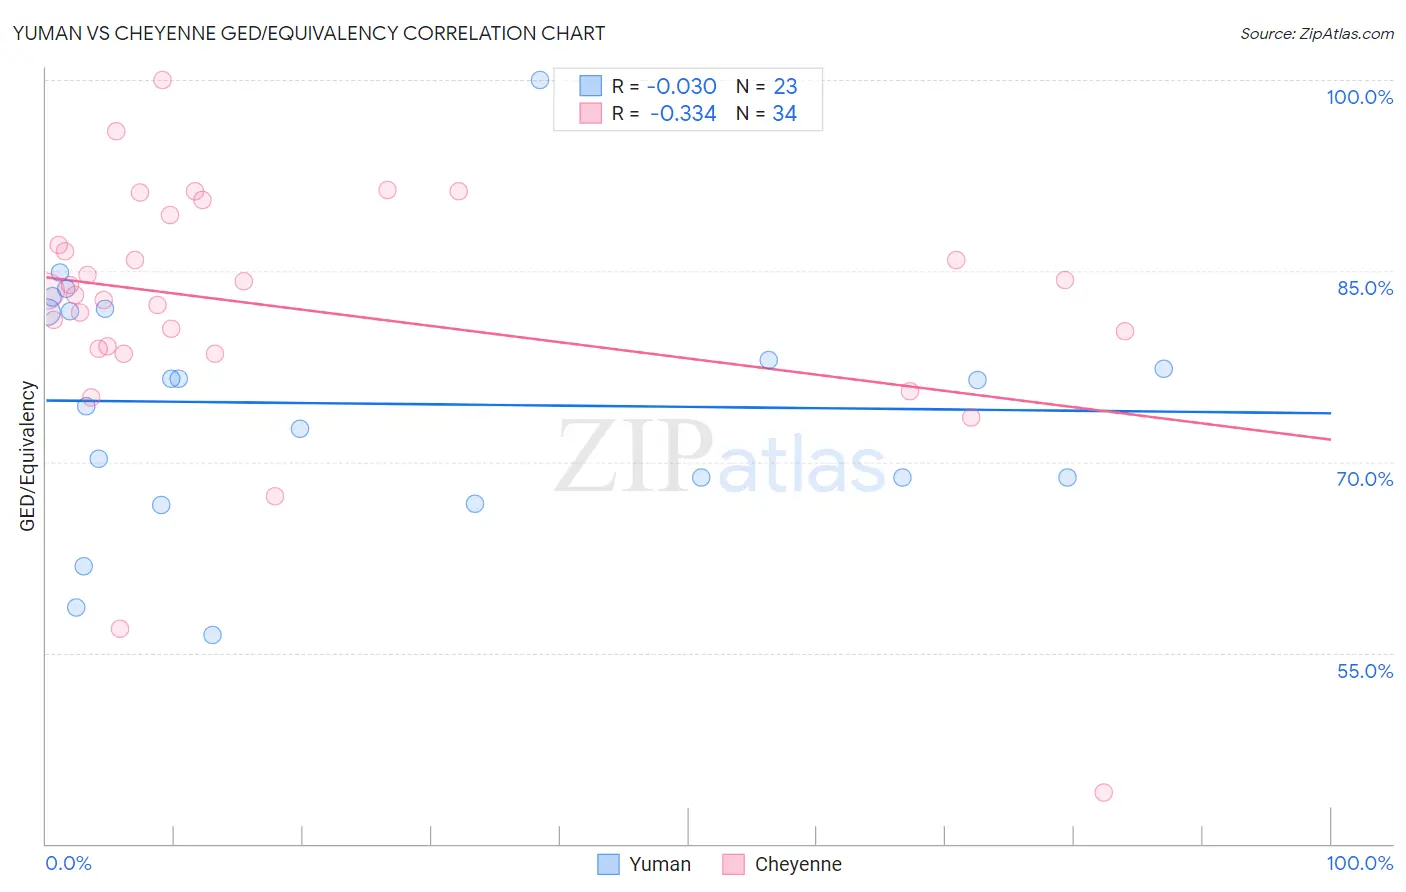
Yuman vs Cheyenne GED/Equivalency Correlation Chart
The statistical analysis conducted on geographies consisting of 40,696,349 people shows no correlation between the proportion of Yuman and percentage of population with at least ged/equivalency education in the United States with a correlation coefficient (R) of -0.030 and weighted average of 79.2%. Similarly, the statistical analysis conducted on geographies consisting of 80,719,411 people shows a mild negative correlation between the proportion of Cheyenne and percentage of population with at least ged/equivalency education in the United States with a correlation coefficient (R) of -0.334 and weighted average of 82.7%, a difference of 4.4%.
GED/Equivalency Correlation Summary
| Measurement | Yuman | Cheyenne |
| Minimum | 56.4% | 44.1% |
| Maximum | 100.0% | 100.0% |
| Range | 43.6% | 55.9% |
| Mean | 74.6% | 81.9% |
| Median | 76.5% | 83.3% |
| Interquartile 25% (IQ1) | 68.8% | 78.8% |
| Interquartile 75% (IQ3) | 81.9% | 87.0% |
| Interquartile Range (IQR) | 13.1% | 8.2% |
| Standard Deviation (Sample) | 9.8% | 10.4% |
| Standard Deviation (Population) | 9.5% | 10.3% |
Similar Demographics by GED/Equivalency
Demographics Similar to Yuman by GED/Equivalency
In terms of ged/equivalency, the demographic groups most similar to Yuman are Central American (79.2%, a difference of 0.020%), Honduran (79.3%, a difference of 0.090%), Hispanic or Latino (79.1%, a difference of 0.13%), Dominican (79.1%, a difference of 0.17%), and Mexican American Indian (79.4%, a difference of 0.21%).
| Demographics | Rating | Rank | GED/Equivalency |
| Immigrants | Belize | 0.0 /100 | #319 | Tragic 80.5% |
| Immigrants | Cuba | 0.0 /100 | #320 | Tragic 80.2% |
| Yup'ik | 0.0 /100 | #321 | Tragic 80.0% |
| Lumbee | 0.0 /100 | #322 | Tragic 80.0% |
| Immigrants | Nicaragua | 0.0 /100 | #323 | Tragic 79.9% |
| Mexican American Indians | 0.0 /100 | #324 | Tragic 79.4% |
| Hondurans | 0.0 /100 | #325 | Tragic 79.3% |
| Yuman | 0.0 /100 | #326 | Tragic 79.2% |
| Central Americans | 0.0 /100 | #327 | Tragic 79.2% |
| Hispanics or Latinos | 0.0 /100 | #328 | Tragic 79.1% |
| Dominicans | 0.0 /100 | #329 | Tragic 79.1% |
| Immigrants | Cabo Verde | 0.0 /100 | #330 | Tragic 78.9% |
| Immigrants | Honduras | 0.0 /100 | #331 | Tragic 78.7% |
| Immigrants | Azores | 0.0 /100 | #332 | Tragic 78.7% |
| Salvadorans | 0.0 /100 | #333 | Tragic 78.6% |
Demographics Similar to Cheyenne by GED/Equivalency
In terms of ged/equivalency, the demographic groups most similar to Cheyenne are Immigrants from Laos (82.7%, a difference of 0.010%), Immigrants from Fiji (82.7%, a difference of 0.010%), Arapaho (82.8%, a difference of 0.050%), Black/African American (82.8%, a difference of 0.060%), and Seminole (82.8%, a difference of 0.090%).
| Demographics | Rating | Rank | GED/Equivalency |
| Pennsylvania Germans | 0.1 /100 | #273 | Tragic 82.9% |
| Immigrants | Trinidad and Tobago | 0.1 /100 | #274 | Tragic 82.8% |
| Seminole | 0.1 /100 | #275 | Tragic 82.8% |
| Blacks/African Americans | 0.1 /100 | #276 | Tragic 82.8% |
| Arapaho | 0.1 /100 | #277 | Tragic 82.8% |
| Immigrants | Laos | 0.1 /100 | #278 | Tragic 82.7% |
| Immigrants | Fiji | 0.1 /100 | #279 | Tragic 82.7% |
| Cheyenne | 0.1 /100 | #280 | Tragic 82.7% |
| Sioux | 0.1 /100 | #281 | Tragic 82.6% |
| Immigrants | Immigrants | 0.1 /100 | #282 | Tragic 82.6% |
| Indonesians | 0.1 /100 | #283 | Tragic 82.5% |
| Immigrants | Barbados | 0.1 /100 | #284 | Tragic 82.4% |
| Cajuns | 0.0 /100 | #285 | Tragic 82.4% |
| Immigrants | West Indies | 0.0 /100 | #286 | Tragic 82.4% |
| Japanese | 0.0 /100 | #287 | Tragic 82.4% |