Maltese vs Cheyenne GED/Equivalency
COMPARE
Maltese
Cheyenne
GED/Equivalency
GED/Equivalency Comparison
Maltese
Cheyenne
88.6%
GED/EQUIVALENCY
99.9/ 100
METRIC RATING
20th/ 347
METRIC RANK
82.7%
GED/EQUIVALENCY
0.1/ 100
METRIC RATING
280th/ 347
METRIC RANK
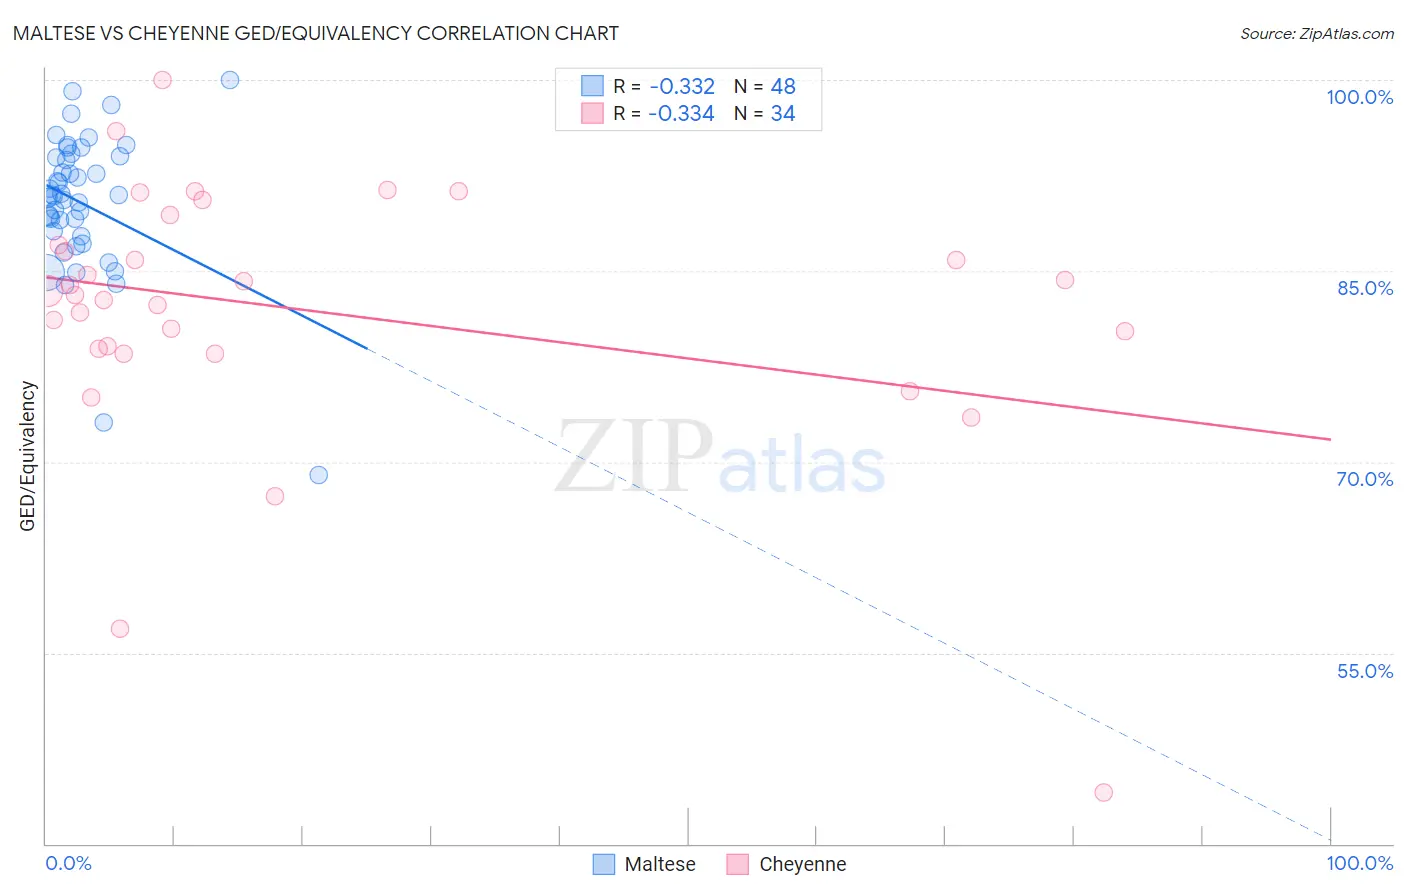
Maltese vs Cheyenne GED/Equivalency Correlation Chart
The statistical analysis conducted on geographies consisting of 126,478,070 people shows a mild negative correlation between the proportion of Maltese and percentage of population with at least ged/equivalency education in the United States with a correlation coefficient (R) of -0.332 and weighted average of 88.6%. Similarly, the statistical analysis conducted on geographies consisting of 80,719,411 people shows a mild negative correlation between the proportion of Cheyenne and percentage of population with at least ged/equivalency education in the United States with a correlation coefficient (R) of -0.334 and weighted average of 82.7%, a difference of 7.1%.
GED/Equivalency Correlation Summary
| Measurement | Maltese | Cheyenne |
| Minimum | 68.9% | 44.1% |
| Maximum | 100.0% | 100.0% |
| Range | 31.1% | 55.9% |
| Mean | 90.3% | 81.9% |
| Median | 90.9% | 83.3% |
| Interquartile 25% (IQ1) | 87.9% | 78.8% |
| Interquartile 75% (IQ3) | 94.0% | 87.0% |
| Interquartile Range (IQR) | 6.0% | 8.2% |
| Standard Deviation (Sample) | 5.7% | 10.4% |
| Standard Deviation (Population) | 5.6% | 10.3% |
Similar Demographics by GED/Equivalency
Demographics Similar to Maltese by GED/Equivalency
In terms of ged/equivalency, the demographic groups most similar to Maltese are Luxembourger (88.6%, a difference of 0.010%), Immigrants from Ireland (88.6%, a difference of 0.020%), Russian (88.6%, a difference of 0.040%), Slovak (88.6%, a difference of 0.040%), and Estonian (88.6%, a difference of 0.040%).
| Demographics | Rating | Rank | GED/Equivalency |
| Immigrants | Iran | 99.9 /100 | #13 | Exceptional 88.9% |
| Cypriots | 99.9 /100 | #14 | Exceptional 88.9% |
| Okinawans | 99.9 /100 | #15 | Exceptional 88.9% |
| Immigrants | Taiwan | 99.9 /100 | #16 | Exceptional 88.8% |
| Croatians | 99.9 /100 | #17 | Exceptional 88.8% |
| Slovenes | 99.9 /100 | #18 | Exceptional 88.8% |
| Swedes | 99.9 /100 | #19 | Exceptional 88.8% |
| Maltese | 99.9 /100 | #20 | Exceptional 88.6% |
| Luxembourgers | 99.8 /100 | #21 | Exceptional 88.6% |
| Immigrants | Ireland | 99.8 /100 | #22 | Exceptional 88.6% |
| Russians | 99.8 /100 | #23 | Exceptional 88.6% |
| Slovaks | 99.8 /100 | #24 | Exceptional 88.6% |
| Estonians | 99.8 /100 | #25 | Exceptional 88.6% |
| Immigrants | Australia | 99.8 /100 | #26 | Exceptional 88.6% |
| Immigrants | Lithuania | 99.8 /100 | #27 | Exceptional 88.6% |
Demographics Similar to Cheyenne by GED/Equivalency
In terms of ged/equivalency, the demographic groups most similar to Cheyenne are Immigrants from Laos (82.7%, a difference of 0.010%), Immigrants from Fiji (82.7%, a difference of 0.010%), Arapaho (82.8%, a difference of 0.050%), Black/African American (82.8%, a difference of 0.060%), and Seminole (82.8%, a difference of 0.090%).
| Demographics | Rating | Rank | GED/Equivalency |
| Pennsylvania Germans | 0.1 /100 | #273 | Tragic 82.9% |
| Immigrants | Trinidad and Tobago | 0.1 /100 | #274 | Tragic 82.8% |
| Seminole | 0.1 /100 | #275 | Tragic 82.8% |
| Blacks/African Americans | 0.1 /100 | #276 | Tragic 82.8% |
| Arapaho | 0.1 /100 | #277 | Tragic 82.8% |
| Immigrants | Laos | 0.1 /100 | #278 | Tragic 82.7% |
| Immigrants | Fiji | 0.1 /100 | #279 | Tragic 82.7% |
| Cheyenne | 0.1 /100 | #280 | Tragic 82.7% |
| Sioux | 0.1 /100 | #281 | Tragic 82.6% |
| Immigrants | Immigrants | 0.1 /100 | #282 | Tragic 82.6% |
| Indonesians | 0.1 /100 | #283 | Tragic 82.5% |
| Immigrants | Barbados | 0.1 /100 | #284 | Tragic 82.4% |
| Cajuns | 0.0 /100 | #285 | Tragic 82.4% |
| Immigrants | West Indies | 0.0 /100 | #286 | Tragic 82.4% |
| Japanese | 0.0 /100 | #287 | Tragic 82.4% |