Paraguayan vs Chippewa GED/Equivalency
COMPARE
Paraguayan
Chippewa
GED/Equivalency
GED/Equivalency Comparison
Paraguayans
Chippewa
86.5%
GED/EQUIVALENCY
84.1/ 100
METRIC RATING
140th/ 347
METRIC RANK
85.2%
GED/EQUIVALENCY
20.8/ 100
METRIC RATING
195th/ 347
METRIC RANK
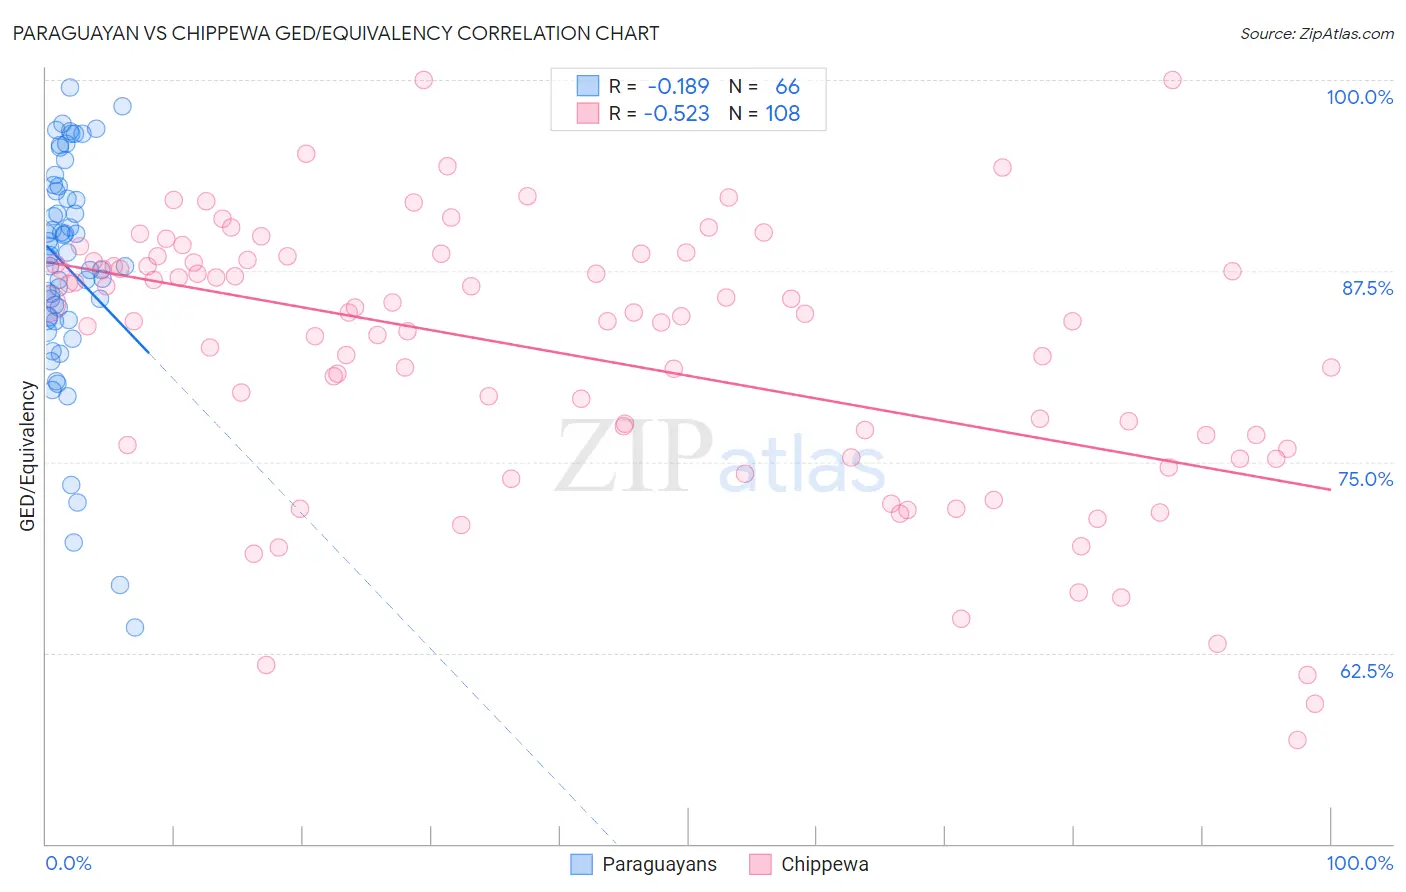
Paraguayan vs Chippewa GED/Equivalency Correlation Chart
The statistical analysis conducted on geographies consisting of 95,114,201 people shows a poor negative correlation between the proportion of Paraguayans and percentage of population with at least ged/equivalency education in the United States with a correlation coefficient (R) of -0.189 and weighted average of 86.5%. Similarly, the statistical analysis conducted on geographies consisting of 215,068,282 people shows a substantial negative correlation between the proportion of Chippewa and percentage of population with at least ged/equivalency education in the United States with a correlation coefficient (R) of -0.523 and weighted average of 85.2%, a difference of 1.5%.
GED/Equivalency Correlation Summary
| Measurement | Paraguayan | Chippewa |
| Minimum | 64.2% | 56.8% |
| Maximum | 99.5% | 100.0% |
| Range | 35.3% | 43.2% |
| Mean | 87.7% | 82.0% |
| Median | 88.5% | 84.4% |
| Interquartile 25% (IQ1) | 84.4% | 76.0% |
| Interquartile 75% (IQ3) | 92.7% | 88.1% |
| Interquartile Range (IQR) | 8.3% | 12.1% |
| Standard Deviation (Sample) | 7.3% | 8.8% |
| Standard Deviation (Population) | 7.3% | 8.8% |
Similar Demographics by GED/Equivalency
Demographics Similar to Paraguayans by GED/Equivalency
In terms of ged/equivalency, the demographic groups most similar to Paraguayans are Immigrants from Malaysia (86.5%, a difference of 0.030%), Laotian (86.5%, a difference of 0.030%), Immigrants from Indonesia (86.4%, a difference of 0.060%), Immigrants from Pakistan (86.4%, a difference of 0.060%), and Bolivian (86.4%, a difference of 0.070%).
| Demographics | Rating | Rank | GED/Equivalency |
| Tsimshian | 88.3 /100 | #133 | Excellent 86.6% |
| Albanians | 87.7 /100 | #134 | Excellent 86.6% |
| Immigrants | Asia | 87.4 /100 | #135 | Excellent 86.6% |
| Chileans | 86.9 /100 | #136 | Excellent 86.6% |
| Arabs | 86.7 /100 | #137 | Excellent 86.6% |
| Immigrants | Argentina | 86.5 /100 | #138 | Excellent 86.6% |
| Immigrants | Malaysia | 85.0 /100 | #139 | Excellent 86.5% |
| Paraguayans | 84.1 /100 | #140 | Excellent 86.5% |
| Laotians | 83.2 /100 | #141 | Excellent 86.5% |
| Immigrants | Indonesia | 82.4 /100 | #142 | Excellent 86.4% |
| Immigrants | Pakistan | 82.4 /100 | #143 | Excellent 86.4% |
| Bolivians | 82.1 /100 | #144 | Excellent 86.4% |
| Pakistanis | 80.4 /100 | #145 | Excellent 86.4% |
| Basques | 79.5 /100 | #146 | Good 86.4% |
| Immigrants | Northern Africa | 79.3 /100 | #147 | Good 86.3% |
Demographics Similar to Chippewa by GED/Equivalency
In terms of ged/equivalency, the demographic groups most similar to Chippewa are Puget Sound Salish (85.2%, a difference of 0.0%), Tongan (85.2%, a difference of 0.0%), Costa Rican (85.2%, a difference of 0.010%), Delaware (85.2%, a difference of 0.040%), and South American Indian (85.2%, a difference of 0.060%).
| Demographics | Rating | Rank | GED/Equivalency |
| Immigrants | Sierra Leone | 29.0 /100 | #188 | Fair 85.4% |
| Guamanians/Chamorros | 28.4 /100 | #189 | Fair 85.3% |
| Alaskan Athabascans | 27.5 /100 | #190 | Fair 85.3% |
| South American Indians | 22.8 /100 | #191 | Fair 85.2% |
| Immigrants | Nonimmigrants | 22.7 /100 | #192 | Fair 85.2% |
| Delaware | 22.2 /100 | #193 | Fair 85.2% |
| Puget Sound Salish | 20.8 /100 | #194 | Fair 85.2% |
| Chippewa | 20.8 /100 | #195 | Fair 85.2% |
| Tongans | 20.7 /100 | #196 | Fair 85.2% |
| Costa Ricans | 20.4 /100 | #197 | Fair 85.2% |
| Immigrants | Africa | 17.5 /100 | #198 | Poor 85.1% |
| Somalis | 16.4 /100 | #199 | Poor 85.0% |
| Uruguayans | 16.0 /100 | #200 | Poor 85.0% |
| Portuguese | 15.9 /100 | #201 | Poor 85.0% |
| Cree | 15.9 /100 | #202 | Poor 85.0% |