Immigrants from Belgium vs Cheyenne GED/Equivalency
COMPARE
Immigrants from Belgium
Cheyenne
GED/Equivalency
GED/Equivalency Comparison
Immigrants from Belgium
Cheyenne
88.3%
GED/EQUIVALENCY
99.7/ 100
METRIC RATING
36th/ 347
METRIC RANK
82.7%
GED/EQUIVALENCY
0.1/ 100
METRIC RATING
280th/ 347
METRIC RANK
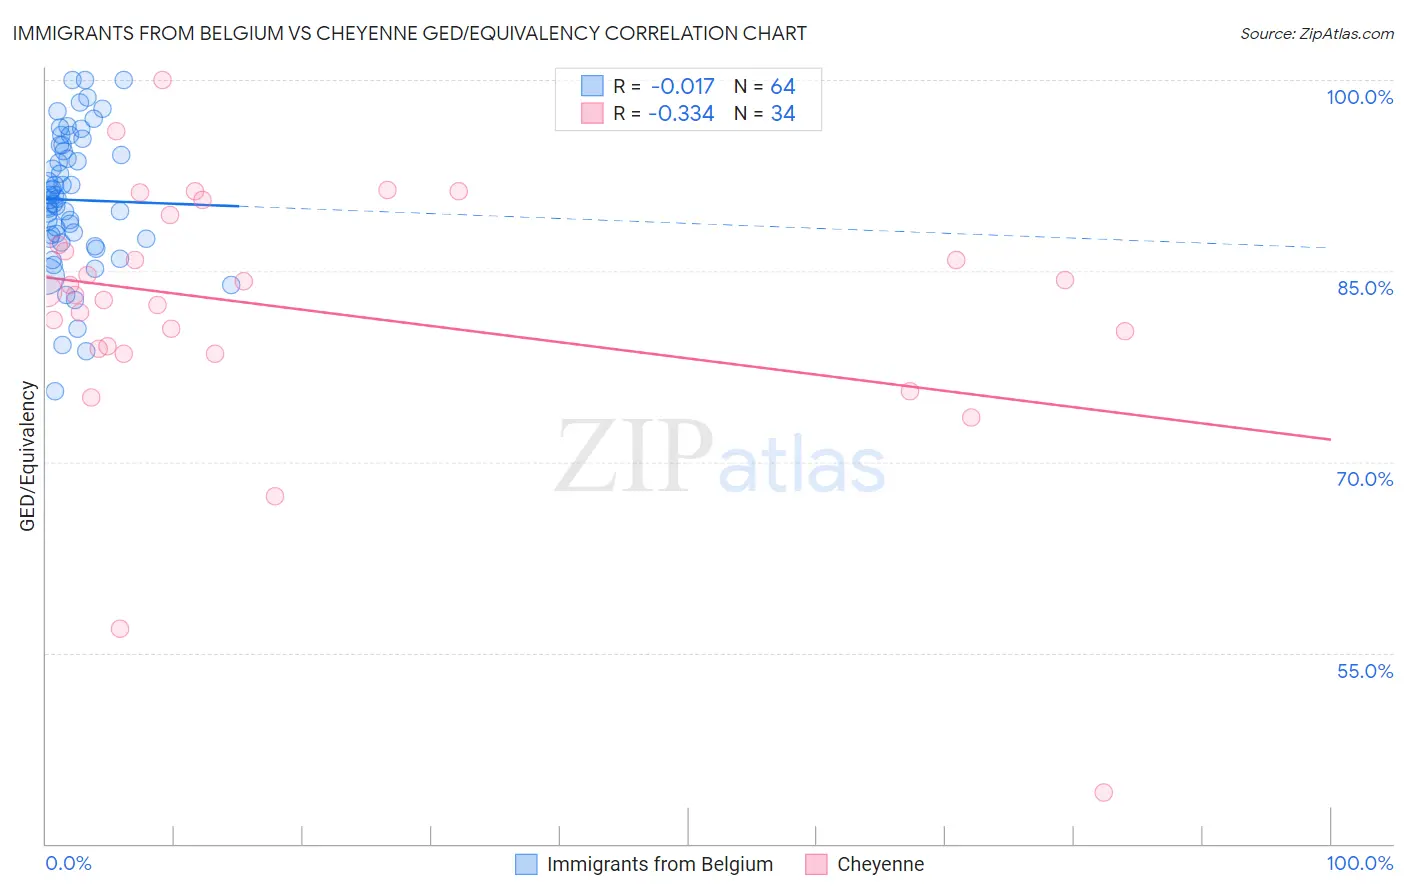
Immigrants from Belgium vs Cheyenne GED/Equivalency Correlation Chart
The statistical analysis conducted on geographies consisting of 146,727,159 people shows no correlation between the proportion of Immigrants from Belgium and percentage of population with at least ged/equivalency education in the United States with a correlation coefficient (R) of -0.017 and weighted average of 88.3%. Similarly, the statistical analysis conducted on geographies consisting of 80,719,411 people shows a mild negative correlation between the proportion of Cheyenne and percentage of population with at least ged/equivalency education in the United States with a correlation coefficient (R) of -0.334 and weighted average of 82.7%, a difference of 6.8%.
GED/Equivalency Correlation Summary
| Measurement | Immigrants from Belgium | Cheyenne |
| Minimum | 75.5% | 44.1% |
| Maximum | 100.0% | 100.0% |
| Range | 24.5% | 55.9% |
| Mean | 90.6% | 81.9% |
| Median | 90.6% | 83.3% |
| Interquartile 25% (IQ1) | 87.5% | 78.8% |
| Interquartile 75% (IQ3) | 94.6% | 87.0% |
| Interquartile Range (IQR) | 7.1% | 8.2% |
| Standard Deviation (Sample) | 5.4% | 10.4% |
| Standard Deviation (Population) | 5.3% | 10.3% |
Similar Demographics by GED/Equivalency
Demographics Similar to Immigrants from Belgium by GED/Equivalency
In terms of ged/equivalency, the demographic groups most similar to Immigrants from Belgium are Immigrants from South Central Asia (88.4%, a difference of 0.020%), Immigrants from Austria (88.3%, a difference of 0.030%), Immigrants from Japan (88.4%, a difference of 0.040%), Immigrants from Sweden (88.4%, a difference of 0.050%), and Burmese (88.3%, a difference of 0.060%).
| Demographics | Rating | Rank | GED/Equivalency |
| Poles | 99.8 /100 | #29 | Exceptional 88.5% |
| Turks | 99.8 /100 | #30 | Exceptional 88.5% |
| Bhutanese | 99.8 /100 | #31 | Exceptional 88.4% |
| Danes | 99.8 /100 | #32 | Exceptional 88.4% |
| Immigrants | Sweden | 99.7 /100 | #33 | Exceptional 88.4% |
| Immigrants | Japan | 99.7 /100 | #34 | Exceptional 88.4% |
| Immigrants | South Central Asia | 99.7 /100 | #35 | Exceptional 88.4% |
| Immigrants | Belgium | 99.7 /100 | #36 | Exceptional 88.3% |
| Immigrants | Austria | 99.7 /100 | #37 | Exceptional 88.3% |
| Burmese | 99.7 /100 | #38 | Exceptional 88.3% |
| Immigrants | Israel | 99.6 /100 | #39 | Exceptional 88.2% |
| Italians | 99.6 /100 | #40 | Exceptional 88.2% |
| Finns | 99.6 /100 | #41 | Exceptional 88.2% |
| Cambodians | 99.6 /100 | #42 | Exceptional 88.2% |
| Immigrants | Scotland | 99.6 /100 | #43 | Exceptional 88.2% |
Demographics Similar to Cheyenne by GED/Equivalency
In terms of ged/equivalency, the demographic groups most similar to Cheyenne are Immigrants from Laos (82.7%, a difference of 0.010%), Immigrants from Fiji (82.7%, a difference of 0.010%), Arapaho (82.8%, a difference of 0.050%), Black/African American (82.8%, a difference of 0.060%), and Seminole (82.8%, a difference of 0.090%).
| Demographics | Rating | Rank | GED/Equivalency |
| Pennsylvania Germans | 0.1 /100 | #273 | Tragic 82.9% |
| Immigrants | Trinidad and Tobago | 0.1 /100 | #274 | Tragic 82.8% |
| Seminole | 0.1 /100 | #275 | Tragic 82.8% |
| Blacks/African Americans | 0.1 /100 | #276 | Tragic 82.8% |
| Arapaho | 0.1 /100 | #277 | Tragic 82.8% |
| Immigrants | Laos | 0.1 /100 | #278 | Tragic 82.7% |
| Immigrants | Fiji | 0.1 /100 | #279 | Tragic 82.7% |
| Cheyenne | 0.1 /100 | #280 | Tragic 82.7% |
| Sioux | 0.1 /100 | #281 | Tragic 82.6% |
| Immigrants | Immigrants | 0.1 /100 | #282 | Tragic 82.6% |
| Indonesians | 0.1 /100 | #283 | Tragic 82.5% |
| Immigrants | Barbados | 0.1 /100 | #284 | Tragic 82.4% |
| Cajuns | 0.0 /100 | #285 | Tragic 82.4% |
| Immigrants | West Indies | 0.0 /100 | #286 | Tragic 82.4% |
| Japanese | 0.0 /100 | #287 | Tragic 82.4% |