Immigrants from Portugal vs Cheyenne GED/Equivalency
COMPARE
Immigrants from Portugal
Cheyenne
GED/Equivalency
GED/Equivalency Comparison
Immigrants from Portugal
Cheyenne
81.6%
GED/EQUIVALENCY
0.0/ 100
METRIC RATING
303rd/ 347
METRIC RANK
82.7%
GED/EQUIVALENCY
0.1/ 100
METRIC RATING
280th/ 347
METRIC RANK
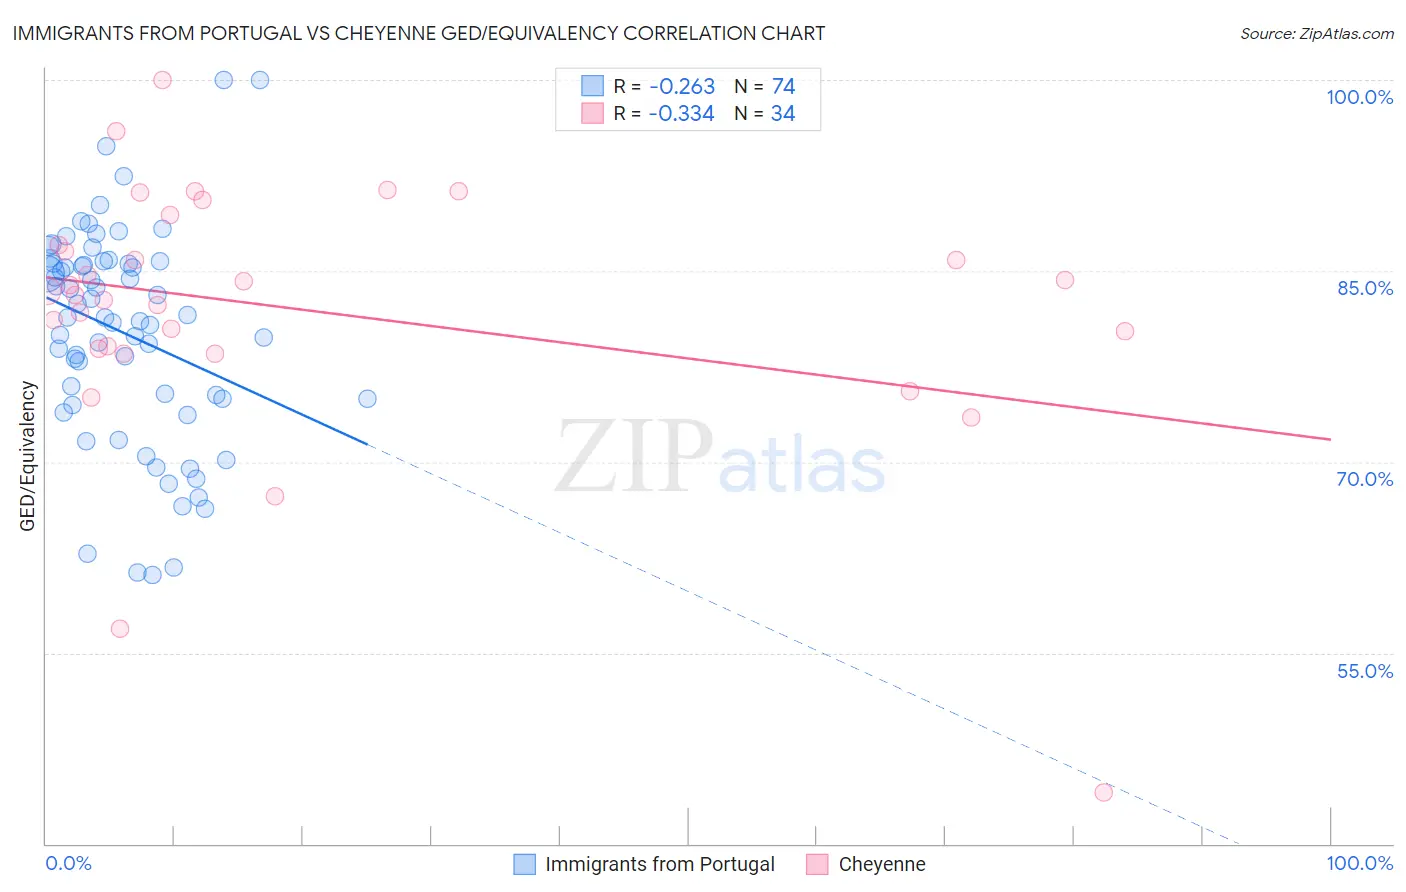
Immigrants from Portugal vs Cheyenne GED/Equivalency Correlation Chart
The statistical analysis conducted on geographies consisting of 174,792,669 people shows a weak negative correlation between the proportion of Immigrants from Portugal and percentage of population with at least ged/equivalency education in the United States with a correlation coefficient (R) of -0.263 and weighted average of 81.6%. Similarly, the statistical analysis conducted on geographies consisting of 80,719,411 people shows a mild negative correlation between the proportion of Cheyenne and percentage of population with at least ged/equivalency education in the United States with a correlation coefficient (R) of -0.334 and weighted average of 82.7%, a difference of 1.4%.
GED/Equivalency Correlation Summary
| Measurement | Immigrants from Portugal | Cheyenne |
| Minimum | 61.1% | 44.1% |
| Maximum | 100.0% | 100.0% |
| Range | 38.9% | 55.9% |
| Mean | 80.1% | 81.9% |
| Median | 81.3% | 83.3% |
| Interquartile 25% (IQ1) | 74.9% | 78.8% |
| Interquartile 75% (IQ3) | 85.6% | 87.0% |
| Interquartile Range (IQR) | 10.7% | 8.2% |
| Standard Deviation (Sample) | 8.5% | 10.4% |
| Standard Deviation (Population) | 8.4% | 10.3% |
Similar Demographics by GED/Equivalency
Demographics Similar to Immigrants from Portugal by GED/Equivalency
In terms of ged/equivalency, the demographic groups most similar to Immigrants from Portugal are Immigrants from Haiti (81.6%, a difference of 0.0%), Dutch West Indian (81.6%, a difference of 0.040%), Fijian (81.6%, a difference of 0.10%), Navajo (81.5%, a difference of 0.10%), and Ecuadorian (81.7%, a difference of 0.17%).
| Demographics | Rating | Rank | GED/Equivalency |
| Vietnamese | 0.0 /100 | #296 | Tragic 81.9% |
| Immigrants | Bangladesh | 0.0 /100 | #297 | Tragic 81.9% |
| Ute | 0.0 /100 | #298 | Tragic 81.8% |
| Ecuadorians | 0.0 /100 | #299 | Tragic 81.7% |
| Fijians | 0.0 /100 | #300 | Tragic 81.6% |
| Dutch West Indians | 0.0 /100 | #301 | Tragic 81.6% |
| Immigrants | Haiti | 0.0 /100 | #302 | Tragic 81.6% |
| Immigrants | Portugal | 0.0 /100 | #303 | Tragic 81.6% |
| Navajo | 0.0 /100 | #304 | Tragic 81.5% |
| Immigrants | Grenada | 0.0 /100 | #305 | Tragic 81.3% |
| Guyanese | 0.0 /100 | #306 | Tragic 81.3% |
| Immigrants | Dominica | 0.0 /100 | #307 | Tragic 81.1% |
| Puerto Ricans | 0.0 /100 | #308 | Tragic 81.1% |
| Immigrants | Ecuador | 0.0 /100 | #309 | Tragic 81.0% |
| Immigrants | Guyana | 0.0 /100 | #310 | Tragic 81.0% |
Demographics Similar to Cheyenne by GED/Equivalency
In terms of ged/equivalency, the demographic groups most similar to Cheyenne are Immigrants from Laos (82.7%, a difference of 0.010%), Immigrants from Fiji (82.7%, a difference of 0.010%), Arapaho (82.8%, a difference of 0.050%), Black/African American (82.8%, a difference of 0.060%), and Seminole (82.8%, a difference of 0.090%).
| Demographics | Rating | Rank | GED/Equivalency |
| Pennsylvania Germans | 0.1 /100 | #273 | Tragic 82.9% |
| Immigrants | Trinidad and Tobago | 0.1 /100 | #274 | Tragic 82.8% |
| Seminole | 0.1 /100 | #275 | Tragic 82.8% |
| Blacks/African Americans | 0.1 /100 | #276 | Tragic 82.8% |
| Arapaho | 0.1 /100 | #277 | Tragic 82.8% |
| Immigrants | Laos | 0.1 /100 | #278 | Tragic 82.7% |
| Immigrants | Fiji | 0.1 /100 | #279 | Tragic 82.7% |
| Cheyenne | 0.1 /100 | #280 | Tragic 82.7% |
| Sioux | 0.1 /100 | #281 | Tragic 82.6% |
| Immigrants | Immigrants | 0.1 /100 | #282 | Tragic 82.6% |
| Indonesians | 0.1 /100 | #283 | Tragic 82.5% |
| Immigrants | Barbados | 0.1 /100 | #284 | Tragic 82.4% |
| Cajuns | 0.0 /100 | #285 | Tragic 82.4% |
| Immigrants | West Indies | 0.0 /100 | #286 | Tragic 82.4% |
| Japanese | 0.0 /100 | #287 | Tragic 82.4% |