Paraguayan vs Cheyenne Per Capita Income
COMPARE
Paraguayan
Cheyenne
Per Capita Income
Per Capita Income Comparison
Paraguayans
Cheyenne
$50,385
PER CAPITA INCOME
99.9/ 100
METRIC RATING
53rd/ 347
METRIC RANK
$35,276
PER CAPITA INCOME
0.0/ 100
METRIC RATING
323rd/ 347
METRIC RANK
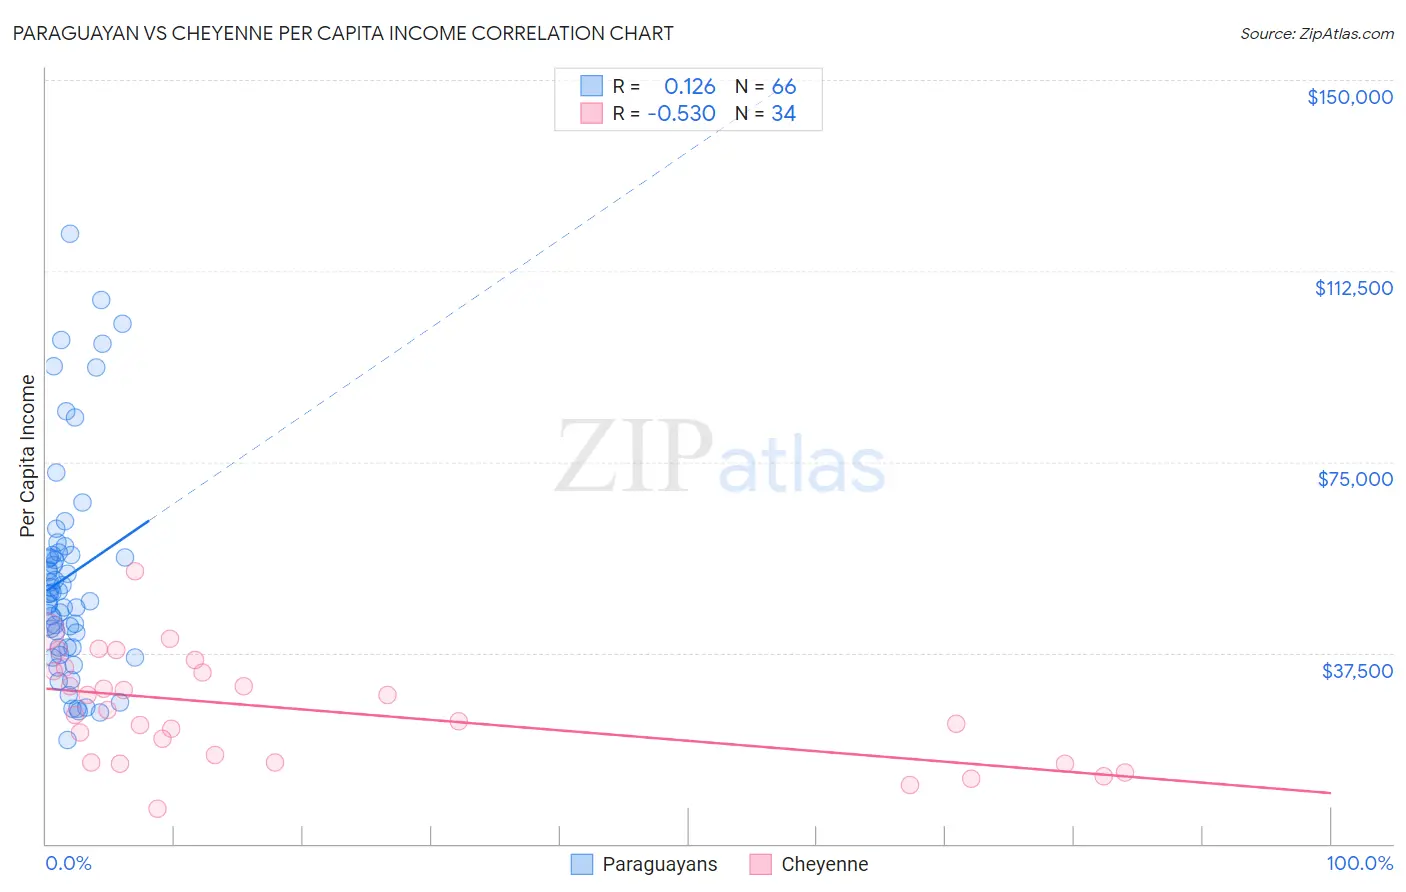
Paraguayan vs Cheyenne Per Capita Income Correlation Chart
The statistical analysis conducted on geographies consisting of 95,089,637 people shows a poor positive correlation between the proportion of Paraguayans and per capita income in the United States with a correlation coefficient (R) of 0.126 and weighted average of $50,385. Similarly, the statistical analysis conducted on geographies consisting of 80,722,590 people shows a substantial negative correlation between the proportion of Cheyenne and per capita income in the United States with a correlation coefficient (R) of -0.530 and weighted average of $35,276, a difference of 42.8%.
Per Capita Income Correlation Summary
| Measurement | Paraguayan | Cheyenne |
| Minimum | $20,486 | $6,772 |
| Maximum | $119,781 | $53,471 |
| Range | $99,295 | $46,699 |
| Mean | $52,548 | $26,352 |
| Median | $49,067 | $25,776 |
| Interquartile 25% (IQ1) | $38,496 | $15,918 |
| Interquartile 75% (IQ3) | $56,770 | $33,955 |
| Interquartile Range (IQR) | $18,274 | $18,037 |
| Standard Deviation (Sample) | $21,489 | $10,544 |
| Standard Deviation (Population) | $21,325 | $10,388 |
Similar Demographics by Per Capita Income
Demographics Similar to Paraguayans by Per Capita Income
In terms of per capita income, the demographic groups most similar to Paraguayans are Immigrants from Croatia ($50,417, a difference of 0.060%), Immigrants from Netherlands ($50,458, a difference of 0.14%), Immigrants from Belarus ($50,303, a difference of 0.16%), Immigrants from Sri Lanka ($50,555, a difference of 0.34%), and New Zealander ($50,575, a difference of 0.38%).
| Demographics | Rating | Rank | Per Capita Income |
| Immigrants | Latvia | 100.0 /100 | #46 | Exceptional $50,914 |
| Bulgarians | 100.0 /100 | #47 | Exceptional $50,906 |
| Immigrants | Serbia | 100.0 /100 | #48 | Exceptional $50,810 |
| New Zealanders | 100.0 /100 | #49 | Exceptional $50,575 |
| Immigrants | Sri Lanka | 100.0 /100 | #50 | Exceptional $50,555 |
| Immigrants | Netherlands | 100.0 /100 | #51 | Exceptional $50,458 |
| Immigrants | Croatia | 99.9 /100 | #52 | Exceptional $50,417 |
| Paraguayans | 99.9 /100 | #53 | Exceptional $50,385 |
| Immigrants | Belarus | 99.9 /100 | #54 | Exceptional $50,303 |
| Immigrants | Western Europe | 99.9 /100 | #55 | Exceptional $50,065 |
| Asians | 99.9 /100 | #56 | Exceptional $50,057 |
| South Africans | 99.9 /100 | #57 | Exceptional $50,044 |
| Immigrants | Malaysia | 99.9 /100 | #58 | Exceptional $49,983 |
| Bhutanese | 99.9 /100 | #59 | Exceptional $49,894 |
| Immigrants | Scotland | 99.9 /100 | #60 | Exceptional $49,893 |
Demographics Similar to Cheyenne by Per Capita Income
In terms of per capita income, the demographic groups most similar to Cheyenne are Kiowa ($35,102, a difference of 0.50%), Creek ($35,546, a difference of 0.76%), Black/African American ($35,564, a difference of 0.82%), Immigrants from Central America ($34,974, a difference of 0.87%), and Immigrants from Cuba ($34,910, a difference of 1.1%).
| Demographics | Rating | Rank | Per Capita Income |
| Choctaw | 0.0 /100 | #316 | Tragic $35,999 |
| Dutch West Indians | 0.0 /100 | #317 | Tragic $35,922 |
| Bangladeshis | 0.0 /100 | #318 | Tragic $35,897 |
| Immigrants | Congo | 0.0 /100 | #319 | Tragic $35,720 |
| Hispanics or Latinos | 0.0 /100 | #320 | Tragic $35,688 |
| Blacks/African Americans | 0.0 /100 | #321 | Tragic $35,564 |
| Creek | 0.0 /100 | #322 | Tragic $35,546 |
| Cheyenne | 0.0 /100 | #323 | Tragic $35,276 |
| Kiowa | 0.0 /100 | #324 | Tragic $35,102 |
| Immigrants | Central America | 0.0 /100 | #325 | Tragic $34,974 |
| Immigrants | Cuba | 0.0 /100 | #326 | Tragic $34,910 |
| Apache | 0.0 /100 | #327 | Tragic $34,886 |
| Menominee | 0.0 /100 | #328 | Tragic $34,578 |
| Mexicans | 0.0 /100 | #329 | Tragic $34,559 |
| Spanish American Indians | 0.0 /100 | #330 | Tragic $34,195 |