Paraguayan vs French American Indian GED/Equivalency
COMPARE
Paraguayan
French American Indian
GED/Equivalency
GED/Equivalency Comparison
Paraguayans
French American Indians
86.5%
GED/EQUIVALENCY
84.1/ 100
METRIC RATING
140th/ 347
METRIC RANK
84.6%
GED/EQUIVALENCY
6.3/ 100
METRIC RATING
224th/ 347
METRIC RANK
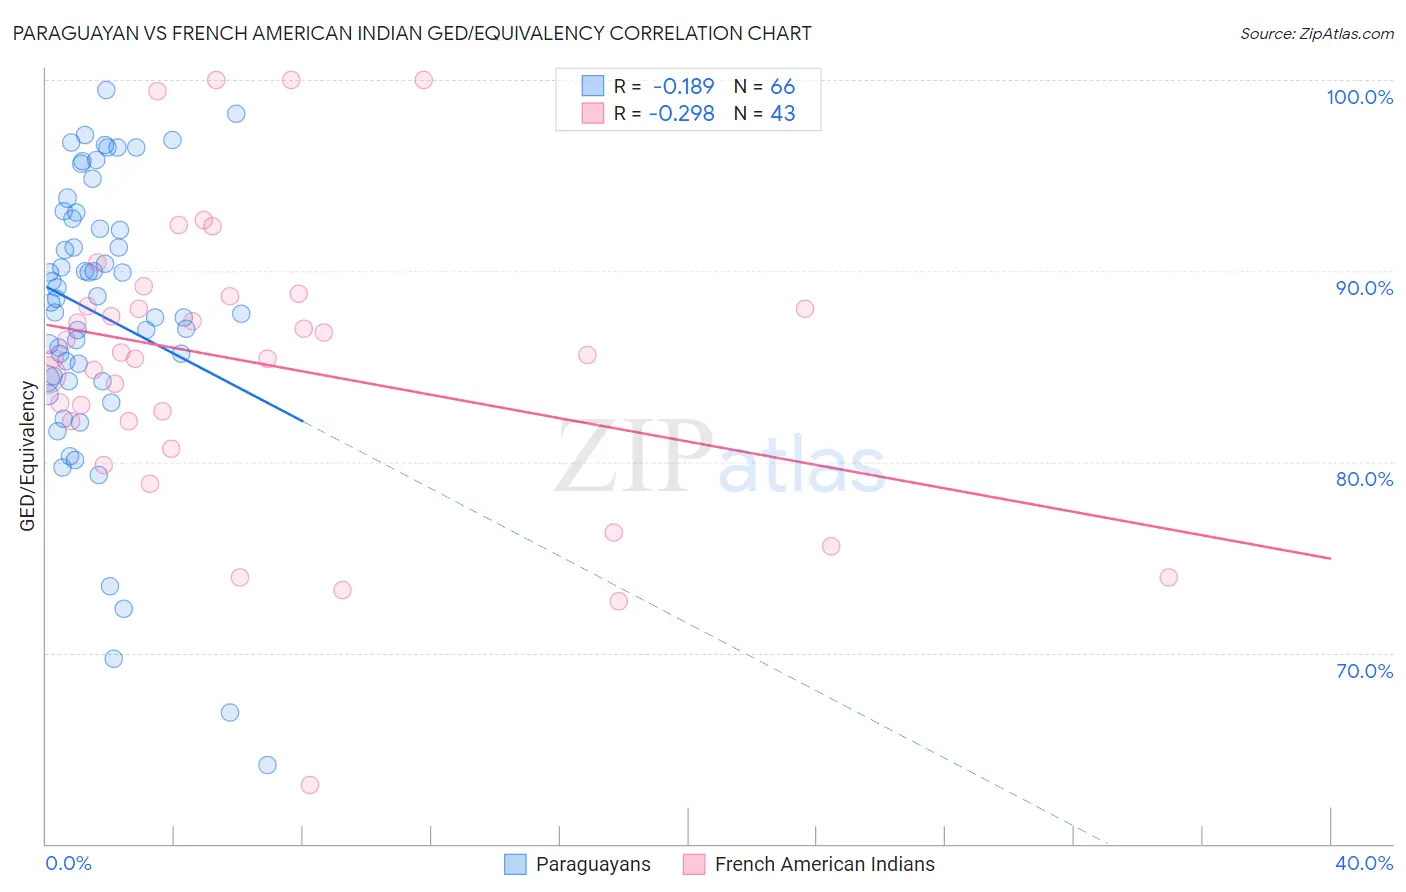
Paraguayan vs French American Indian GED/Equivalency Correlation Chart
The statistical analysis conducted on geographies consisting of 95,114,201 people shows a poor negative correlation between the proportion of Paraguayans and percentage of population with at least ged/equivalency education in the United States with a correlation coefficient (R) of -0.189 and weighted average of 86.5%. Similarly, the statistical analysis conducted on geographies consisting of 131,976,269 people shows a weak negative correlation between the proportion of French American Indians and percentage of population with at least ged/equivalency education in the United States with a correlation coefficient (R) of -0.298 and weighted average of 84.6%, a difference of 2.3%.
GED/Equivalency Correlation Summary
| Measurement | Paraguayan | French American Indian |
| Minimum | 64.2% | 63.0% |
| Maximum | 99.5% | 100.0% |
| Range | 35.3% | 37.0% |
| Mean | 87.7% | 85.2% |
| Median | 88.5% | 85.6% |
| Interquartile 25% (IQ1) | 84.4% | 82.1% |
| Interquartile 75% (IQ3) | 92.7% | 88.7% |
| Interquartile Range (IQR) | 8.3% | 6.6% |
| Standard Deviation (Sample) | 7.3% | 7.7% |
| Standard Deviation (Population) | 7.3% | 7.6% |
Similar Demographics by GED/Equivalency
Demographics Similar to Paraguayans by GED/Equivalency
In terms of ged/equivalency, the demographic groups most similar to Paraguayans are Immigrants from Malaysia (86.5%, a difference of 0.030%), Laotian (86.5%, a difference of 0.030%), Immigrants from Indonesia (86.4%, a difference of 0.060%), Immigrants from Pakistan (86.4%, a difference of 0.060%), and Bolivian (86.4%, a difference of 0.070%).
| Demographics | Rating | Rank | GED/Equivalency |
| Tsimshian | 88.3 /100 | #133 | Excellent 86.6% |
| Albanians | 87.7 /100 | #134 | Excellent 86.6% |
| Immigrants | Asia | 87.4 /100 | #135 | Excellent 86.6% |
| Chileans | 86.9 /100 | #136 | Excellent 86.6% |
| Arabs | 86.7 /100 | #137 | Excellent 86.6% |
| Immigrants | Argentina | 86.5 /100 | #138 | Excellent 86.6% |
| Immigrants | Malaysia | 85.0 /100 | #139 | Excellent 86.5% |
| Paraguayans | 84.1 /100 | #140 | Excellent 86.5% |
| Laotians | 83.2 /100 | #141 | Excellent 86.5% |
| Immigrants | Indonesia | 82.4 /100 | #142 | Excellent 86.4% |
| Immigrants | Pakistan | 82.4 /100 | #143 | Excellent 86.4% |
| Bolivians | 82.1 /100 | #144 | Excellent 86.4% |
| Pakistanis | 80.4 /100 | #145 | Excellent 86.4% |
| Basques | 79.5 /100 | #146 | Good 86.4% |
| Immigrants | Northern Africa | 79.3 /100 | #147 | Good 86.3% |
Demographics Similar to French American Indians by GED/Equivalency
In terms of ged/equivalency, the demographic groups most similar to French American Indians are Immigrants from Thailand (84.5%, a difference of 0.050%), Immigrants from Uzbekistan (84.6%, a difference of 0.070%), Immigrants from Zaire (84.5%, a difference of 0.080%), Iroquois (84.6%, a difference of 0.090%), and Immigrants from Costa Rica (84.5%, a difference of 0.090%).
| Demographics | Rating | Rank | GED/Equivalency |
| Nigerians | 8.6 /100 | #217 | Tragic 84.7% |
| Alaska Natives | 8.6 /100 | #218 | Tragic 84.7% |
| Potawatomi | 8.2 /100 | #219 | Tragic 84.7% |
| Americans | 8.2 /100 | #220 | Tragic 84.7% |
| Taiwanese | 8.1 /100 | #221 | Tragic 84.7% |
| Iroquois | 7.5 /100 | #222 | Tragic 84.6% |
| Immigrants | Uzbekistan | 7.1 /100 | #223 | Tragic 84.6% |
| French American Indians | 6.3 /100 | #224 | Tragic 84.6% |
| Immigrants | Thailand | 5.8 /100 | #225 | Tragic 84.5% |
| Immigrants | Zaire | 5.5 /100 | #226 | Tragic 84.5% |
| Immigrants | Costa Rica | 5.4 /100 | #227 | Tragic 84.5% |
| Immigrants | Liberia | 4.9 /100 | #228 | Tragic 84.4% |
| Immigrants | Uruguay | 4.6 /100 | #229 | Tragic 84.4% |
| Immigrants | Colombia | 4.5 /100 | #230 | Tragic 84.4% |
| Immigrants | Middle Africa | 4.3 /100 | #231 | Tragic 84.4% |