Paraguayan vs Immigrants from Congo GED/Equivalency
COMPARE
Paraguayan
Immigrants from Congo
GED/Equivalency
GED/Equivalency Comparison
Paraguayans
Immigrants from Congo
86.5%
GED/EQUIVALENCY
84.1/ 100
METRIC RATING
140th/ 347
METRIC RANK
83.1%
GED/EQUIVALENCY
0.2/ 100
METRIC RATING
263rd/ 347
METRIC RANK
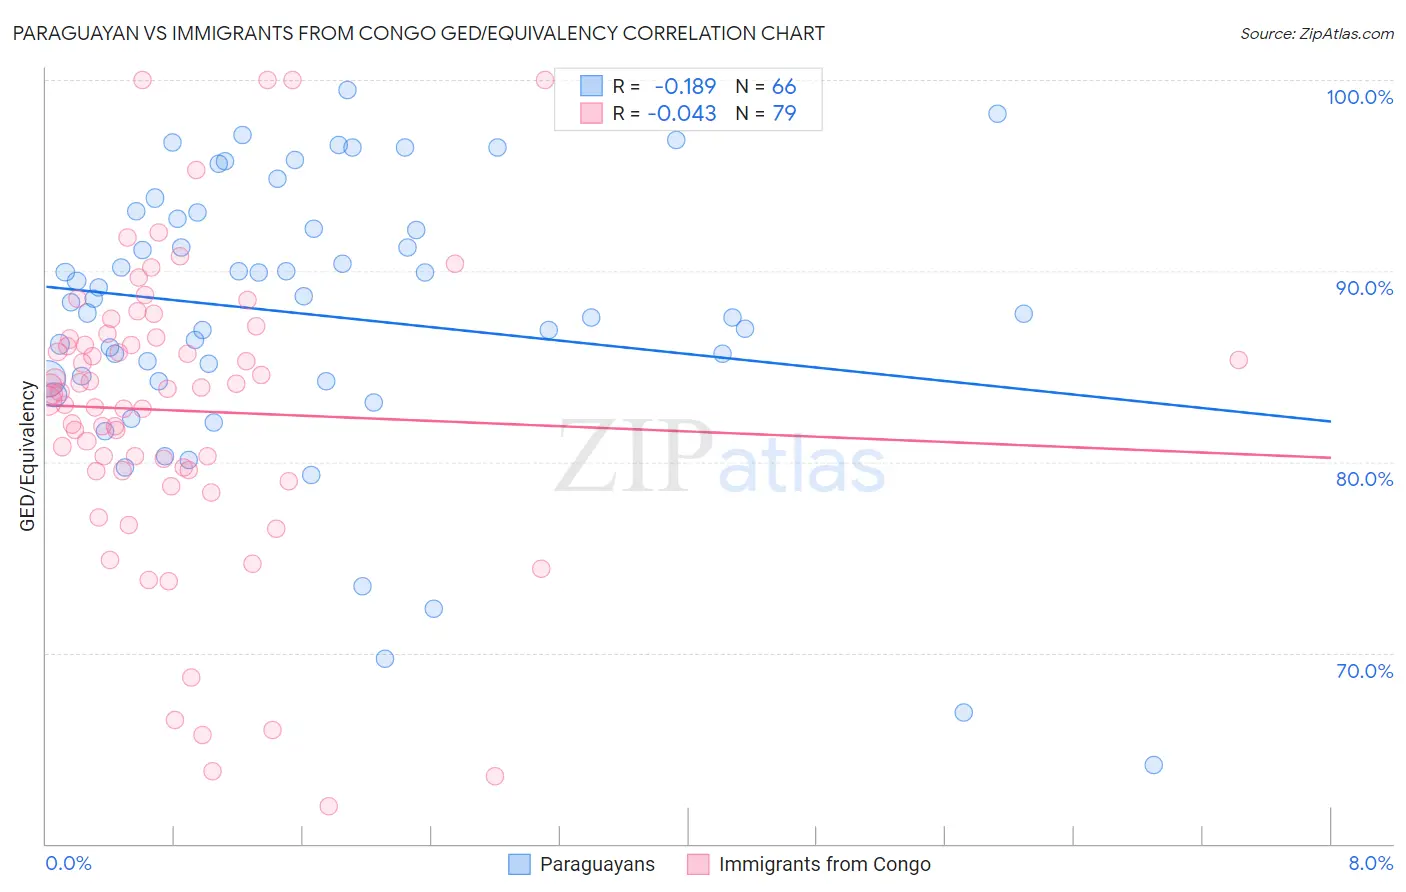
Paraguayan vs Immigrants from Congo GED/Equivalency Correlation Chart
The statistical analysis conducted on geographies consisting of 95,114,201 people shows a poor negative correlation between the proportion of Paraguayans and percentage of population with at least ged/equivalency education in the United States with a correlation coefficient (R) of -0.189 and weighted average of 86.5%. Similarly, the statistical analysis conducted on geographies consisting of 92,095,910 people shows no correlation between the proportion of Immigrants from Congo and percentage of population with at least ged/equivalency education in the United States with a correlation coefficient (R) of -0.043 and weighted average of 83.1%, a difference of 4.1%.
GED/Equivalency Correlation Summary
| Measurement | Paraguayan | Immigrants from Congo |
| Minimum | 64.2% | 62.0% |
| Maximum | 99.5% | 100.0% |
| Range | 35.3% | 38.0% |
| Mean | 87.7% | 82.7% |
| Median | 88.5% | 83.7% |
| Interquartile 25% (IQ1) | 84.4% | 79.5% |
| Interquartile 75% (IQ3) | 92.7% | 86.5% |
| Interquartile Range (IQR) | 8.3% | 7.0% |
| Standard Deviation (Sample) | 7.3% | 7.9% |
| Standard Deviation (Population) | 7.3% | 7.8% |
Similar Demographics by GED/Equivalency
Demographics Similar to Paraguayans by GED/Equivalency
In terms of ged/equivalency, the demographic groups most similar to Paraguayans are Immigrants from Malaysia (86.5%, a difference of 0.030%), Laotian (86.5%, a difference of 0.030%), Immigrants from Indonesia (86.4%, a difference of 0.060%), Immigrants from Pakistan (86.4%, a difference of 0.060%), and Bolivian (86.4%, a difference of 0.070%).
| Demographics | Rating | Rank | GED/Equivalency |
| Tsimshian | 88.3 /100 | #133 | Excellent 86.6% |
| Albanians | 87.7 /100 | #134 | Excellent 86.6% |
| Immigrants | Asia | 87.4 /100 | #135 | Excellent 86.6% |
| Chileans | 86.9 /100 | #136 | Excellent 86.6% |
| Arabs | 86.7 /100 | #137 | Excellent 86.6% |
| Immigrants | Argentina | 86.5 /100 | #138 | Excellent 86.6% |
| Immigrants | Malaysia | 85.0 /100 | #139 | Excellent 86.5% |
| Paraguayans | 84.1 /100 | #140 | Excellent 86.5% |
| Laotians | 83.2 /100 | #141 | Excellent 86.5% |
| Immigrants | Indonesia | 82.4 /100 | #142 | Excellent 86.4% |
| Immigrants | Pakistan | 82.4 /100 | #143 | Excellent 86.4% |
| Bolivians | 82.1 /100 | #144 | Excellent 86.4% |
| Pakistanis | 80.4 /100 | #145 | Excellent 86.4% |
| Basques | 79.5 /100 | #146 | Good 86.4% |
| Immigrants | Northern Africa | 79.3 /100 | #147 | Good 86.3% |
Demographics Similar to Immigrants from Congo by GED/Equivalency
In terms of ged/equivalency, the demographic groups most similar to Immigrants from Congo are Inupiat (83.1%, a difference of 0.010%), Immigrants from Armenia (83.1%, a difference of 0.010%), Bangladeshi (83.1%, a difference of 0.010%), West Indian (83.1%, a difference of 0.020%), and Kiowa (83.1%, a difference of 0.030%).
| Demographics | Rating | Rank | GED/Equivalency |
| Africans | 0.5 /100 | #256 | Tragic 83.4% |
| Jamaicans | 0.4 /100 | #257 | Tragic 83.3% |
| Malaysians | 0.4 /100 | #258 | Tragic 83.3% |
| Immigrants | Vietnam | 0.3 /100 | #259 | Tragic 83.2% |
| Choctaw | 0.3 /100 | #260 | Tragic 83.1% |
| Inupiat | 0.2 /100 | #261 | Tragic 83.1% |
| Immigrants | Armenia | 0.2 /100 | #262 | Tragic 83.1% |
| Immigrants | Congo | 0.2 /100 | #263 | Tragic 83.1% |
| Bangladeshis | 0.2 /100 | #264 | Tragic 83.1% |
| West Indians | 0.2 /100 | #265 | Tragic 83.1% |
| Kiowa | 0.2 /100 | #266 | Tragic 83.1% |
| Trinidadians and Tobagonians | 0.2 /100 | #267 | Tragic 83.0% |
| Immigrants | Burma/Myanmar | 0.2 /100 | #268 | Tragic 83.0% |
| Hopi | 0.2 /100 | #269 | Tragic 83.0% |
| Immigrants | Jamaica | 0.2 /100 | #270 | Tragic 82.9% |