Estonian vs Immigrants from Nepal GED/Equivalency
COMPARE
Estonian
Immigrants from Nepal
GED/Equivalency
GED/Equivalency Comparison
Estonians
Immigrants from Nepal
88.6%
GED/EQUIVALENCY
99.8/ 100
METRIC RATING
25th/ 347
METRIC RANK
86.2%
GED/EQUIVALENCY
73.3/ 100
METRIC RATING
156th/ 347
METRIC RANK
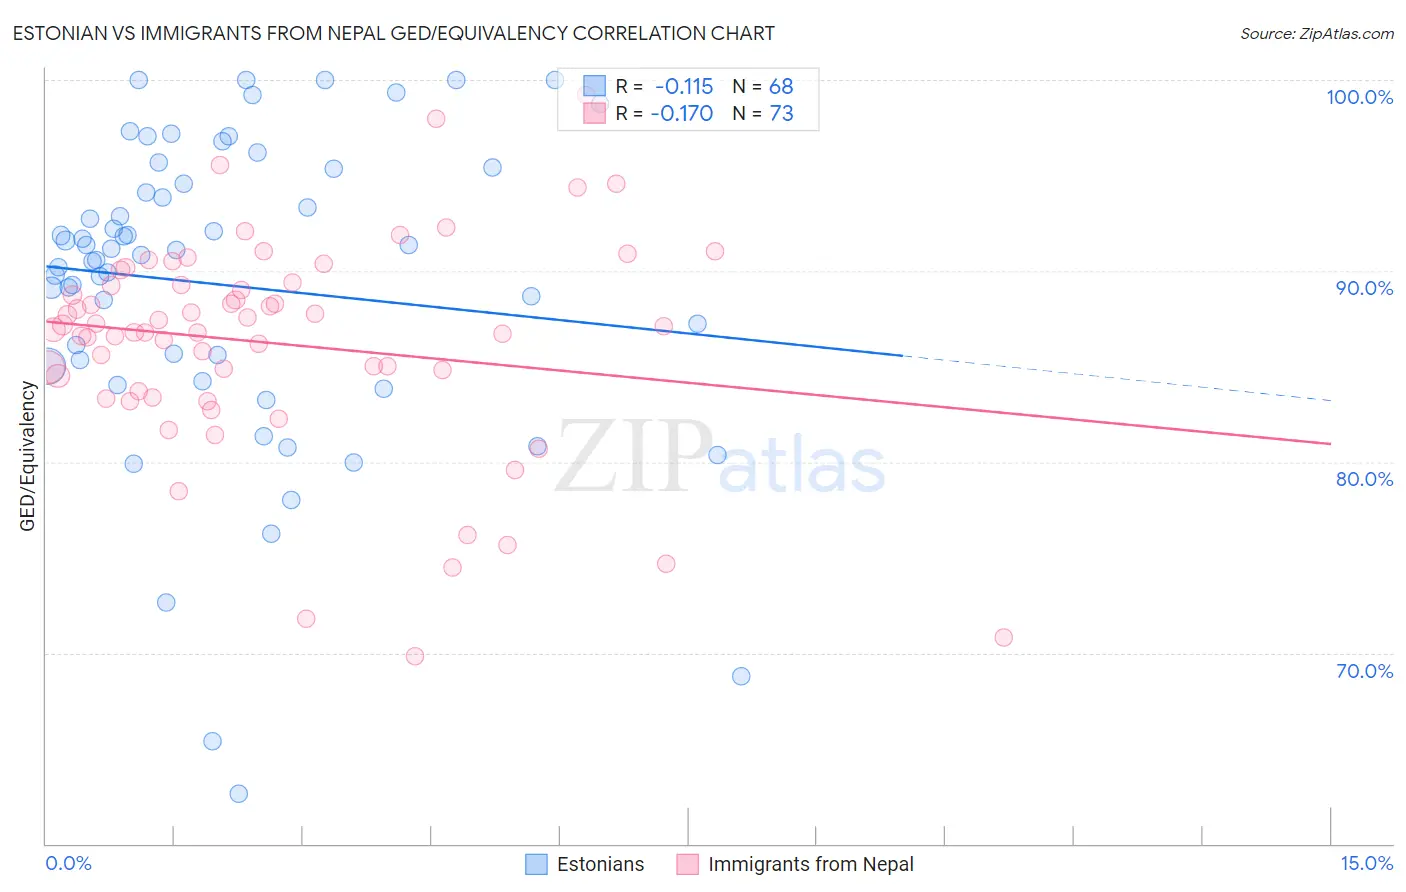
Estonian vs Immigrants from Nepal GED/Equivalency Correlation Chart
The statistical analysis conducted on geographies consisting of 123,527,724 people shows a poor negative correlation between the proportion of Estonians and percentage of population with at least ged/equivalency education in the United States with a correlation coefficient (R) of -0.115 and weighted average of 88.6%. Similarly, the statistical analysis conducted on geographies consisting of 186,780,807 people shows a poor negative correlation between the proportion of Immigrants from Nepal and percentage of population with at least ged/equivalency education in the United States with a correlation coefficient (R) of -0.170 and weighted average of 86.2%, a difference of 2.8%.
GED/Equivalency Correlation Summary
| Measurement | Estonian | Immigrants from Nepal |
| Minimum | 62.6% | 69.8% |
| Maximum | 100.0% | 99.2% |
| Range | 37.4% | 29.4% |
| Mean | 89.2% | 86.2% |
| Median | 91.0% | 86.9% |
| Interquartile 25% (IQ1) | 85.2% | 83.5% |
| Interquartile 75% (IQ3) | 94.9% | 89.3% |
| Interquartile Range (IQR) | 9.8% | 5.8% |
| Standard Deviation (Sample) | 8.1% | 5.7% |
| Standard Deviation (Population) | 8.1% | 5.7% |
Similar Demographics by GED/Equivalency
Demographics Similar to Estonians by GED/Equivalency
In terms of ged/equivalency, the demographic groups most similar to Estonians are Russian (88.6%, a difference of 0.0%), Slovak (88.6%, a difference of 0.0%), Immigrants from Australia (88.6%, a difference of 0.0%), Immigrants from Ireland (88.6%, a difference of 0.020%), and Luxembourger (88.6%, a difference of 0.030%).
| Demographics | Rating | Rank | GED/Equivalency |
| Slovenes | 99.9 /100 | #18 | Exceptional 88.8% |
| Swedes | 99.9 /100 | #19 | Exceptional 88.8% |
| Maltese | 99.9 /100 | #20 | Exceptional 88.6% |
| Luxembourgers | 99.8 /100 | #21 | Exceptional 88.6% |
| Immigrants | Ireland | 99.8 /100 | #22 | Exceptional 88.6% |
| Russians | 99.8 /100 | #23 | Exceptional 88.6% |
| Slovaks | 99.8 /100 | #24 | Exceptional 88.6% |
| Estonians | 99.8 /100 | #25 | Exceptional 88.6% |
| Immigrants | Australia | 99.8 /100 | #26 | Exceptional 88.6% |
| Immigrants | Lithuania | 99.8 /100 | #27 | Exceptional 88.6% |
| Immigrants | Northern Europe | 99.8 /100 | #28 | Exceptional 88.5% |
| Poles | 99.8 /100 | #29 | Exceptional 88.5% |
| Turks | 99.8 /100 | #30 | Exceptional 88.5% |
| Bhutanese | 99.8 /100 | #31 | Exceptional 88.4% |
| Danes | 99.8 /100 | #32 | Exceptional 88.4% |
Demographics Similar to Immigrants from Nepal by GED/Equivalency
In terms of ged/equivalency, the demographic groups most similar to Immigrants from Nepal are White/Caucasian (86.2%, a difference of 0.030%), German Russian (86.2%, a difference of 0.030%), Immigrants from Kenya (86.2%, a difference of 0.040%), Iraqi (86.2%, a difference of 0.050%), and Armenian (86.3%, a difference of 0.080%).
| Demographics | Rating | Rank | GED/Equivalency |
| Menominee | 79.3 /100 | #149 | Good 86.3% |
| Immigrants | Western Asia | 78.8 /100 | #150 | Good 86.3% |
| Immigrants | Bosnia and Herzegovina | 77.9 /100 | #151 | Good 86.3% |
| Brazilians | 77.2 /100 | #152 | Good 86.3% |
| Kenyans | 76.6 /100 | #153 | Good 86.3% |
| Armenians | 76.4 /100 | #154 | Good 86.3% |
| Iraqis | 75.2 /100 | #155 | Good 86.2% |
| Immigrants | Nepal | 73.3 /100 | #156 | Good 86.2% |
| Whites/Caucasians | 72.2 /100 | #157 | Good 86.2% |
| German Russians | 72.1 /100 | #158 | Good 86.2% |
| Immigrants | Kenya | 71.8 /100 | #159 | Good 86.2% |
| Immigrants | Morocco | 69.5 /100 | #160 | Good 86.1% |
| Immigrants | Syria | 69.3 /100 | #161 | Good 86.1% |
| Immigrants | Iraq | 68.1 /100 | #162 | Good 86.1% |
| Ugandans | 66.3 /100 | #163 | Good 86.1% |