Bulgarian vs Immigrants from Nepal GED/Equivalency
COMPARE
Bulgarian
Immigrants from Nepal
GED/Equivalency
GED/Equivalency Comparison
Bulgarians
Immigrants from Nepal
89.0%
GED/EQUIVALENCY
99.9/ 100
METRIC RATING
11th/ 347
METRIC RANK
86.2%
GED/EQUIVALENCY
73.3/ 100
METRIC RATING
156th/ 347
METRIC RANK
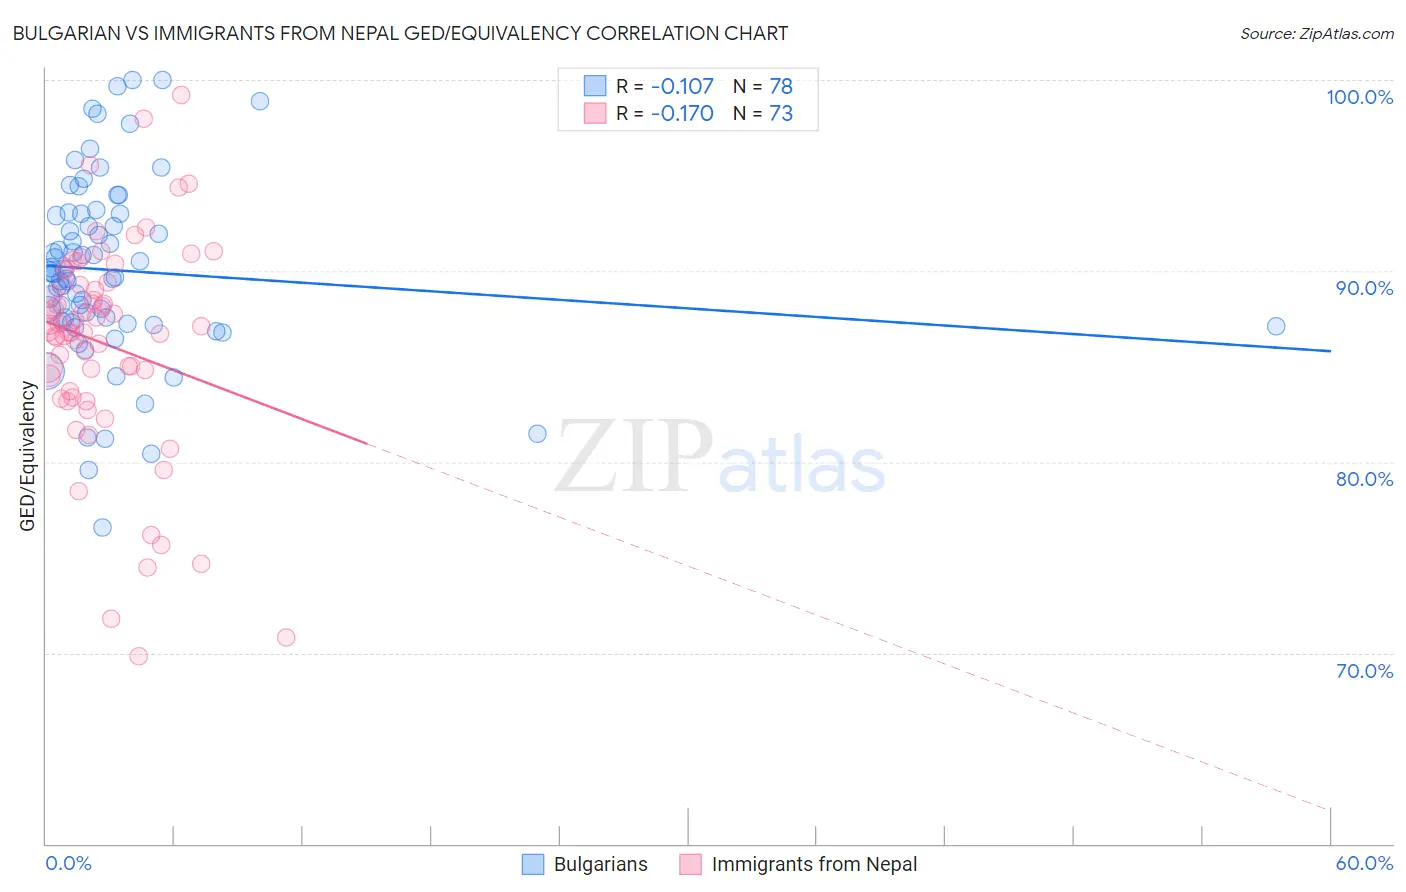
Bulgarian vs Immigrants from Nepal GED/Equivalency Correlation Chart
The statistical analysis conducted on geographies consisting of 205,633,746 people shows a poor negative correlation between the proportion of Bulgarians and percentage of population with at least ged/equivalency education in the United States with a correlation coefficient (R) of -0.107 and weighted average of 89.0%. Similarly, the statistical analysis conducted on geographies consisting of 186,780,807 people shows a poor negative correlation between the proportion of Immigrants from Nepal and percentage of population with at least ged/equivalency education in the United States with a correlation coefficient (R) of -0.170 and weighted average of 86.2%, a difference of 3.2%.
GED/Equivalency Correlation Summary
| Measurement | Bulgarian | Immigrants from Nepal |
| Minimum | 76.5% | 69.8% |
| Maximum | 100.0% | 99.2% |
| Range | 23.5% | 29.4% |
| Mean | 90.0% | 86.2% |
| Median | 89.9% | 86.9% |
| Interquartile 25% (IQ1) | 87.3% | 83.5% |
| Interquartile 75% (IQ3) | 93.0% | 89.3% |
| Interquartile Range (IQR) | 5.6% | 5.8% |
| Standard Deviation (Sample) | 4.8% | 5.7% |
| Standard Deviation (Population) | 4.8% | 5.7% |
Similar Demographics by GED/Equivalency
Demographics Similar to Bulgarians by GED/Equivalency
In terms of ged/equivalency, the demographic groups most similar to Bulgarians are Norwegian (89.0%, a difference of 0.040%), Lithuanian (88.9%, a difference of 0.040%), Immigrants from Iran (88.9%, a difference of 0.050%), Chinese (89.0%, a difference of 0.080%), and Cypriot (88.9%, a difference of 0.080%).
| Demographics | Rating | Rank | GED/Equivalency |
| Iranians | 100.0 /100 | #4 | Exceptional 89.2% |
| Latvians | 100.0 /100 | #5 | Exceptional 89.2% |
| Thais | 100.0 /100 | #6 | Exceptional 89.1% |
| Eastern Europeans | 99.9 /100 | #7 | Exceptional 89.1% |
| Carpatho Rusyns | 99.9 /100 | #8 | Exceptional 89.1% |
| Chinese | 99.9 /100 | #9 | Exceptional 89.0% |
| Norwegians | 99.9 /100 | #10 | Exceptional 89.0% |
| Bulgarians | 99.9 /100 | #11 | Exceptional 89.0% |
| Lithuanians | 99.9 /100 | #12 | Exceptional 88.9% |
| Immigrants | Iran | 99.9 /100 | #13 | Exceptional 88.9% |
| Cypriots | 99.9 /100 | #14 | Exceptional 88.9% |
| Okinawans | 99.9 /100 | #15 | Exceptional 88.9% |
| Immigrants | Taiwan | 99.9 /100 | #16 | Exceptional 88.8% |
| Croatians | 99.9 /100 | #17 | Exceptional 88.8% |
| Slovenes | 99.9 /100 | #18 | Exceptional 88.8% |
Demographics Similar to Immigrants from Nepal by GED/Equivalency
In terms of ged/equivalency, the demographic groups most similar to Immigrants from Nepal are White/Caucasian (86.2%, a difference of 0.030%), German Russian (86.2%, a difference of 0.030%), Immigrants from Kenya (86.2%, a difference of 0.040%), Iraqi (86.2%, a difference of 0.050%), and Armenian (86.3%, a difference of 0.080%).
| Demographics | Rating | Rank | GED/Equivalency |
| Menominee | 79.3 /100 | #149 | Good 86.3% |
| Immigrants | Western Asia | 78.8 /100 | #150 | Good 86.3% |
| Immigrants | Bosnia and Herzegovina | 77.9 /100 | #151 | Good 86.3% |
| Brazilians | 77.2 /100 | #152 | Good 86.3% |
| Kenyans | 76.6 /100 | #153 | Good 86.3% |
| Armenians | 76.4 /100 | #154 | Good 86.3% |
| Iraqis | 75.2 /100 | #155 | Good 86.2% |
| Immigrants | Nepal | 73.3 /100 | #156 | Good 86.2% |
| Whites/Caucasians | 72.2 /100 | #157 | Good 86.2% |
| German Russians | 72.1 /100 | #158 | Good 86.2% |
| Immigrants | Kenya | 71.8 /100 | #159 | Good 86.2% |
| Immigrants | Morocco | 69.5 /100 | #160 | Good 86.1% |
| Immigrants | Syria | 69.3 /100 | #161 | Good 86.1% |
| Immigrants | Iraq | 68.1 /100 | #162 | Good 86.1% |
| Ugandans | 66.3 /100 | #163 | Good 86.1% |