Immigrants from Venezuela vs Immigrants from Nepal GED/Equivalency
COMPARE
Immigrants from Venezuela
Immigrants from Nepal
GED/Equivalency
GED/Equivalency Comparison
Immigrants from Venezuela
Immigrants from Nepal
85.8%
GED/EQUIVALENCY
50.7/ 100
METRIC RATING
173rd/ 347
METRIC RANK
86.2%
GED/EQUIVALENCY
73.3/ 100
METRIC RATING
156th/ 347
METRIC RANK
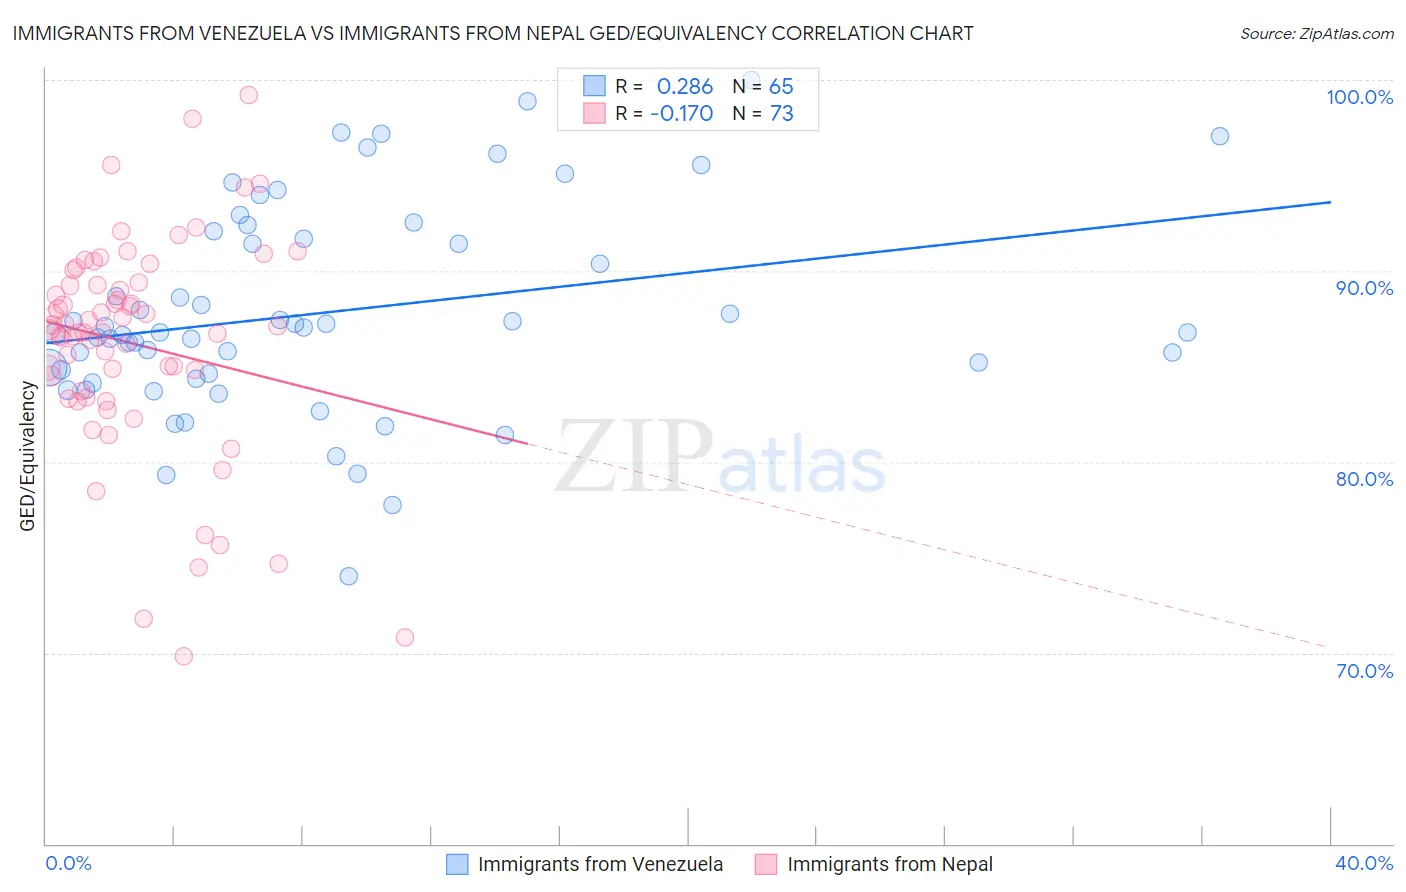
Immigrants from Venezuela vs Immigrants from Nepal GED/Equivalency Correlation Chart
The statistical analysis conducted on geographies consisting of 287,866,009 people shows a weak positive correlation between the proportion of Immigrants from Venezuela and percentage of population with at least ged/equivalency education in the United States with a correlation coefficient (R) of 0.286 and weighted average of 85.8%. Similarly, the statistical analysis conducted on geographies consisting of 186,780,807 people shows a poor negative correlation between the proportion of Immigrants from Nepal and percentage of population with at least ged/equivalency education in the United States with a correlation coefficient (R) of -0.170 and weighted average of 86.2%, a difference of 0.50%.
GED/Equivalency Correlation Summary
| Measurement | Immigrants from Venezuela | Immigrants from Nepal |
| Minimum | 74.0% | 69.8% |
| Maximum | 100.0% | 99.2% |
| Range | 26.0% | 29.4% |
| Mean | 87.8% | 86.2% |
| Median | 86.8% | 86.9% |
| Interquartile 25% (IQ1) | 84.5% | 83.5% |
| Interquartile 75% (IQ3) | 91.9% | 89.3% |
| Interquartile Range (IQR) | 7.4% | 5.8% |
| Standard Deviation (Sample) | 5.4% | 5.7% |
| Standard Deviation (Population) | 5.4% | 5.7% |
Demographics Similar to Immigrants from Venezuela and Immigrants from Nepal by GED/Equivalency
In terms of ged/equivalency, the demographic groups most similar to Immigrants from Venezuela are Ottawa (85.8%, a difference of 0.010%), Bermudan (85.8%, a difference of 0.090%), Immigrants from Chile (85.9%, a difference of 0.14%), Afghan (85.9%, a difference of 0.19%), and Immigrants from Ethiopia (86.0%, a difference of 0.22%). Similarly, the demographic groups most similar to Immigrants from Nepal are White/Caucasian (86.2%, a difference of 0.030%), German Russian (86.2%, a difference of 0.030%), Immigrants from Kenya (86.2%, a difference of 0.040%), Iraqi (86.2%, a difference of 0.050%), and Armenian (86.3%, a difference of 0.080%).
| Demographics | Rating | Rank | GED/Equivalency |
| Armenians | 76.4 /100 | #154 | Good 86.3% |
| Iraqis | 75.2 /100 | #155 | Good 86.2% |
| Immigrants | Nepal | 73.3 /100 | #156 | Good 86.2% |
| Whites/Caucasians | 72.2 /100 | #157 | Good 86.2% |
| German Russians | 72.1 /100 | #158 | Good 86.2% |
| Immigrants | Kenya | 71.8 /100 | #159 | Good 86.2% |
| Immigrants | Morocco | 69.5 /100 | #160 | Good 86.1% |
| Immigrants | Syria | 69.3 /100 | #161 | Good 86.1% |
| Immigrants | Iraq | 68.1 /100 | #162 | Good 86.1% |
| Ugandans | 66.3 /100 | #163 | Good 86.1% |
| Venezuelans | 65.5 /100 | #164 | Good 86.0% |
| Alsatians | 64.3 /100 | #165 | Good 86.0% |
| Immigrants | Albania | 64.2 /100 | #166 | Good 86.0% |
| Ethiopians | 63.7 /100 | #167 | Good 86.0% |
| Sierra Leoneans | 61.8 /100 | #168 | Good 86.0% |
| Immigrants | Ethiopia | 61.2 /100 | #169 | Good 86.0% |
| Afghans | 59.7 /100 | #170 | Average 85.9% |
| Immigrants | Chile | 57.3 /100 | #171 | Average 85.9% |
| Bermudans | 55.1 /100 | #172 | Average 85.8% |
| Immigrants | Venezuela | 50.7 /100 | #173 | Average 85.8% |
| Ottawa | 50.0 /100 | #174 | Average 85.8% |