Puerto Rican vs Immigrants from Nepal GED/Equivalency
COMPARE
Puerto Rican
Immigrants from Nepal
GED/Equivalency
GED/Equivalency Comparison
Puerto Ricans
Immigrants from Nepal
81.1%
GED/EQUIVALENCY
0.0/ 100
METRIC RATING
308th/ 347
METRIC RANK
86.2%
GED/EQUIVALENCY
73.3/ 100
METRIC RATING
156th/ 347
METRIC RANK
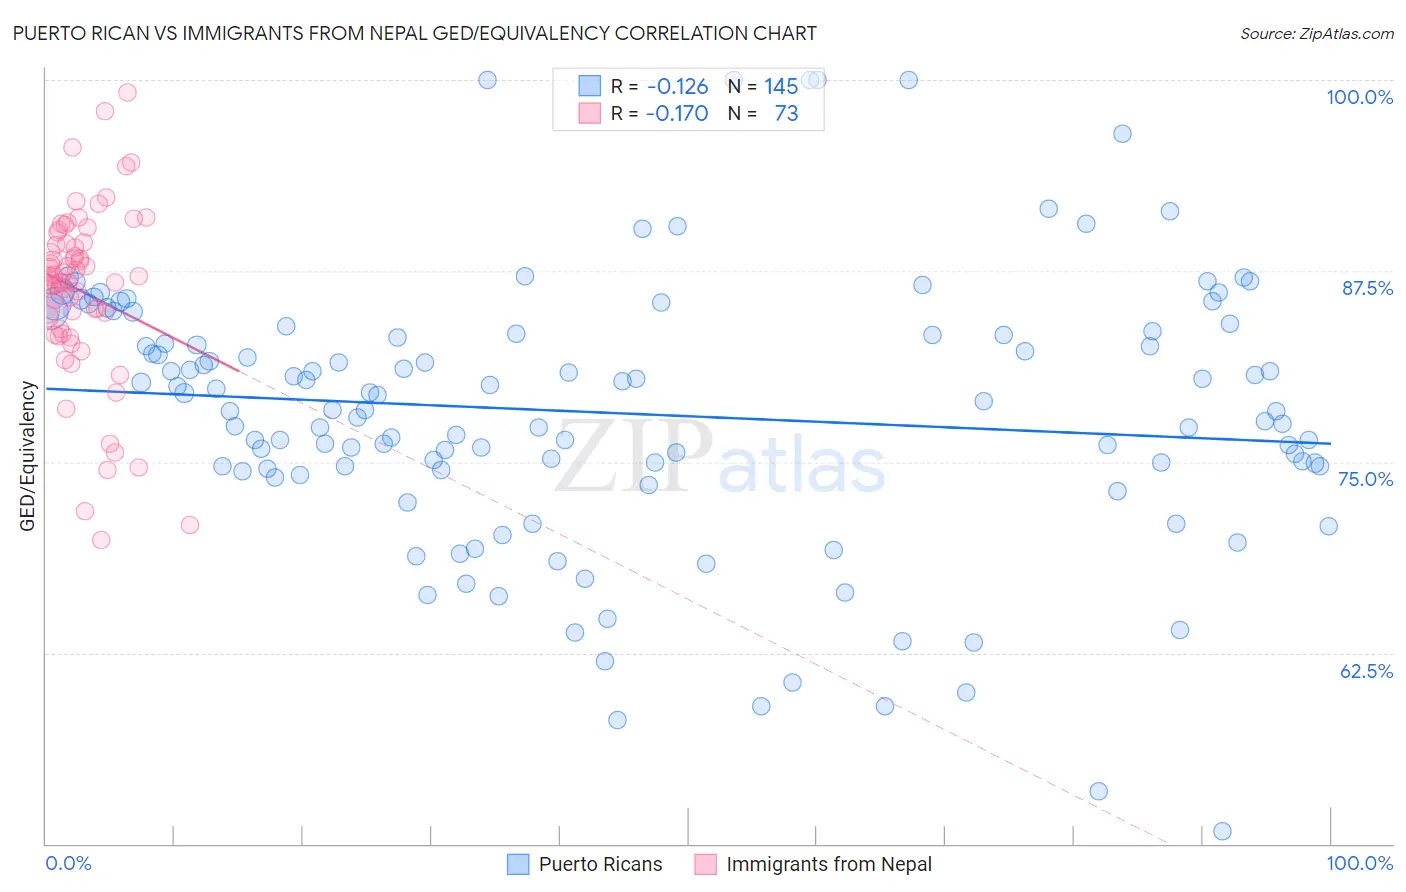
Puerto Rican vs Immigrants from Nepal GED/Equivalency Correlation Chart
The statistical analysis conducted on geographies consisting of 528,320,760 people shows a poor negative correlation between the proportion of Puerto Ricans and percentage of population with at least ged/equivalency education in the United States with a correlation coefficient (R) of -0.126 and weighted average of 81.1%. Similarly, the statistical analysis conducted on geographies consisting of 186,780,807 people shows a poor negative correlation between the proportion of Immigrants from Nepal and percentage of population with at least ged/equivalency education in the United States with a correlation coefficient (R) of -0.170 and weighted average of 86.2%, a difference of 6.3%.
GED/Equivalency Correlation Summary
| Measurement | Puerto Rican | Immigrants from Nepal |
| Minimum | 50.8% | 69.8% |
| Maximum | 100.0% | 99.2% |
| Range | 49.2% | 29.4% |
| Mean | 78.2% | 86.2% |
| Median | 78.4% | 86.9% |
| Interquartile 25% (IQ1) | 74.5% | 83.5% |
| Interquartile 75% (IQ3) | 83.5% | 89.3% |
| Interquartile Range (IQR) | 9.0% | 5.8% |
| Standard Deviation (Sample) | 9.0% | 5.7% |
| Standard Deviation (Population) | 8.9% | 5.7% |
Similar Demographics by GED/Equivalency
Demographics Similar to Puerto Ricans by GED/Equivalency
In terms of ged/equivalency, the demographic groups most similar to Puerto Ricans are Immigrants from Ecuador (81.0%, a difference of 0.080%), Immigrants from Dominica (81.1%, a difference of 0.10%), Immigrants from Guyana (81.0%, a difference of 0.14%), Native/Alaskan (80.9%, a difference of 0.14%), and Nicaraguan (80.9%, a difference of 0.18%).
| Demographics | Rating | Rank | GED/Equivalency |
| Dutch West Indians | 0.0 /100 | #301 | Tragic 81.6% |
| Immigrants | Haiti | 0.0 /100 | #302 | Tragic 81.6% |
| Immigrants | Portugal | 0.0 /100 | #303 | Tragic 81.6% |
| Navajo | 0.0 /100 | #304 | Tragic 81.5% |
| Immigrants | Grenada | 0.0 /100 | #305 | Tragic 81.3% |
| Guyanese | 0.0 /100 | #306 | Tragic 81.3% |
| Immigrants | Dominica | 0.0 /100 | #307 | Tragic 81.1% |
| Puerto Ricans | 0.0 /100 | #308 | Tragic 81.1% |
| Immigrants | Ecuador | 0.0 /100 | #309 | Tragic 81.0% |
| Immigrants | Guyana | 0.0 /100 | #310 | Tragic 81.0% |
| Natives/Alaskans | 0.0 /100 | #311 | Tragic 80.9% |
| Nicaraguans | 0.0 /100 | #312 | Tragic 80.9% |
| Cape Verdeans | 0.0 /100 | #313 | Tragic 80.9% |
| Belizeans | 0.0 /100 | #314 | Tragic 80.9% |
| Apache | 0.0 /100 | #315 | Tragic 80.7% |
Demographics Similar to Immigrants from Nepal by GED/Equivalency
In terms of ged/equivalency, the demographic groups most similar to Immigrants from Nepal are White/Caucasian (86.2%, a difference of 0.030%), German Russian (86.2%, a difference of 0.030%), Immigrants from Kenya (86.2%, a difference of 0.040%), Iraqi (86.2%, a difference of 0.050%), and Armenian (86.3%, a difference of 0.080%).
| Demographics | Rating | Rank | GED/Equivalency |
| Menominee | 79.3 /100 | #149 | Good 86.3% |
| Immigrants | Western Asia | 78.8 /100 | #150 | Good 86.3% |
| Immigrants | Bosnia and Herzegovina | 77.9 /100 | #151 | Good 86.3% |
| Brazilians | 77.2 /100 | #152 | Good 86.3% |
| Kenyans | 76.6 /100 | #153 | Good 86.3% |
| Armenians | 76.4 /100 | #154 | Good 86.3% |
| Iraqis | 75.2 /100 | #155 | Good 86.2% |
| Immigrants | Nepal | 73.3 /100 | #156 | Good 86.2% |
| Whites/Caucasians | 72.2 /100 | #157 | Good 86.2% |
| German Russians | 72.1 /100 | #158 | Good 86.2% |
| Immigrants | Kenya | 71.8 /100 | #159 | Good 86.2% |
| Immigrants | Morocco | 69.5 /100 | #160 | Good 86.1% |
| Immigrants | Syria | 69.3 /100 | #161 | Good 86.1% |
| Immigrants | Iraq | 68.1 /100 | #162 | Good 86.1% |
| Ugandans | 66.3 /100 | #163 | Good 86.1% |