Macedonian vs Immigrants from Nepal Vision Disability
COMPARE
Macedonian
Immigrants from Nepal
Vision Disability
Vision Disability Comparison
Macedonians
Immigrants from Nepal
2.0%
VISION DISABILITY
99.3/ 100
METRIC RATING
54th/ 347
METRIC RANK
1.9%
VISION DISABILITY
99.9/ 100
METRIC RATING
30th/ 347
METRIC RANK
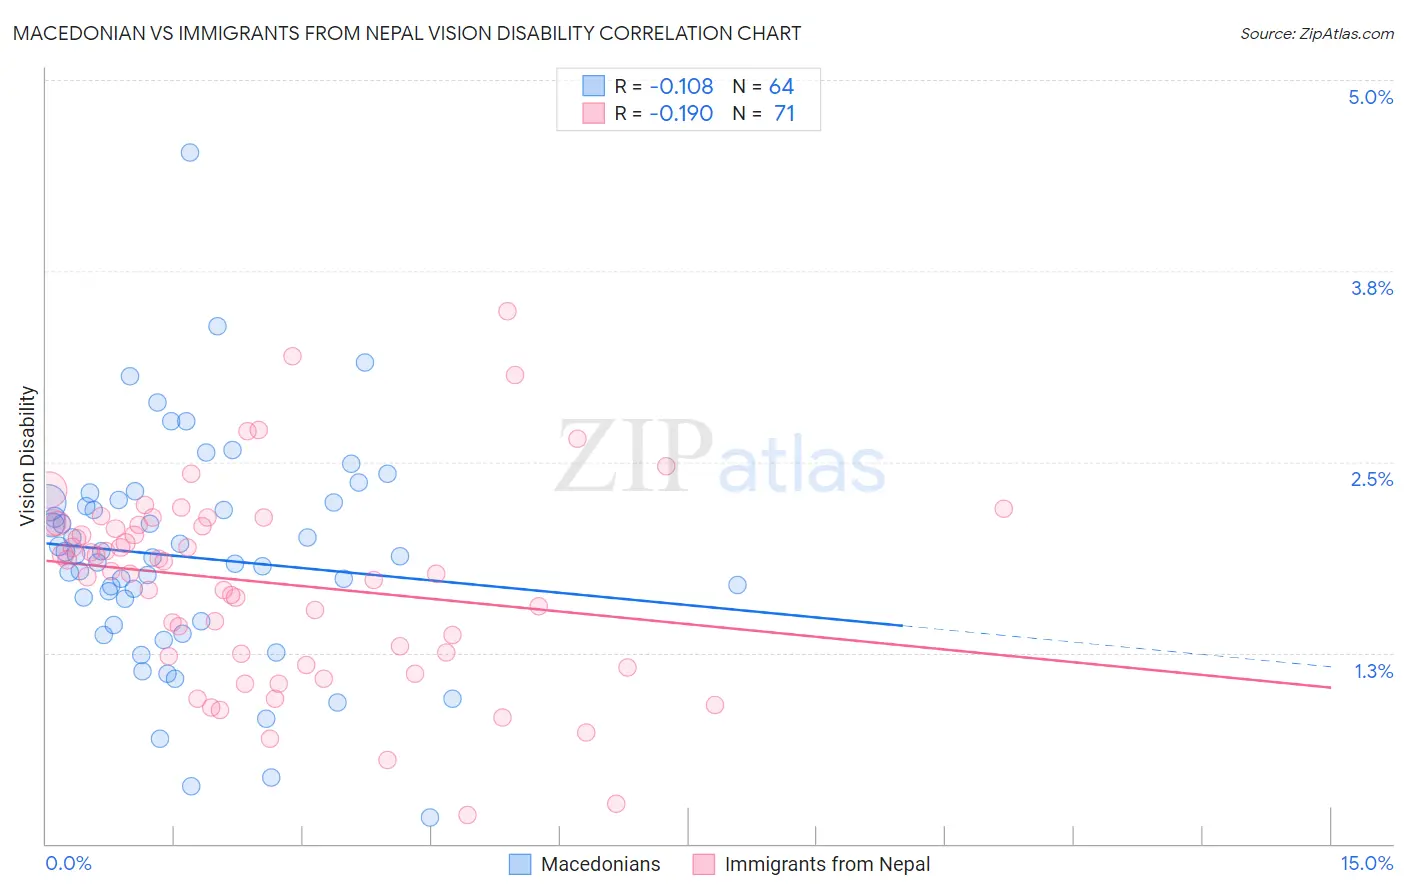
Macedonian vs Immigrants from Nepal Vision Disability Correlation Chart
The statistical analysis conducted on geographies consisting of 132,627,302 people shows a poor negative correlation between the proportion of Macedonians and percentage of population with vision disability in the United States with a correlation coefficient (R) of -0.108 and weighted average of 2.0%. Similarly, the statistical analysis conducted on geographies consisting of 186,747,403 people shows a poor negative correlation between the proportion of Immigrants from Nepal and percentage of population with vision disability in the United States with a correlation coefficient (R) of -0.190 and weighted average of 1.9%, a difference of 3.4%.
Vision Disability Correlation Summary
| Measurement | Macedonian | Immigrants from Nepal |
| Minimum | 0.17% | 0.19% |
| Maximum | 4.5% | 3.5% |
| Range | 4.4% | 3.3% |
| Mean | 1.9% | 1.7% |
| Median | 1.9% | 1.8% |
| Interquartile 25% (IQ1) | 1.4% | 1.2% |
| Interquartile 75% (IQ3) | 2.2% | 2.1% |
| Interquartile Range (IQR) | 0.79% | 0.87% |
| Standard Deviation (Sample) | 0.73% | 0.65% |
| Standard Deviation (Population) | 0.73% | 0.65% |
Similar Demographics by Vision Disability
Demographics Similar to Macedonians by Vision Disability
In terms of vision disability, the demographic groups most similar to Macedonians are Immigrants from Belarus (2.0%, a difference of 0.040%), Laotian (2.0%, a difference of 0.060%), Immigrants from Serbia (2.0%, a difference of 0.15%), Jordanian (2.0%, a difference of 0.22%), and Somali (2.0%, a difference of 0.24%).
| Demographics | Rating | Rank | Vision Disability |
| Immigrants | Bulgaria | 99.7 /100 | #47 | Exceptional 2.0% |
| Israelis | 99.6 /100 | #48 | Exceptional 2.0% |
| Latvians | 99.5 /100 | #49 | Exceptional 2.0% |
| Afghans | 99.5 /100 | #50 | Exceptional 2.0% |
| Tongans | 99.5 /100 | #51 | Exceptional 2.0% |
| Immigrants | Serbia | 99.4 /100 | #52 | Exceptional 2.0% |
| Immigrants | Belarus | 99.3 /100 | #53 | Exceptional 2.0% |
| Macedonians | 99.3 /100 | #54 | Exceptional 2.0% |
| Laotians | 99.3 /100 | #55 | Exceptional 2.0% |
| Jordanians | 99.2 /100 | #56 | Exceptional 2.0% |
| Somalis | 99.2 /100 | #57 | Exceptional 2.0% |
| Immigrants | Saudi Arabia | 99.2 /100 | #58 | Exceptional 2.0% |
| Argentineans | 99.1 /100 | #59 | Exceptional 2.0% |
| Immigrants | Romania | 99.1 /100 | #60 | Exceptional 2.0% |
| Immigrants | Belgium | 99.1 /100 | #61 | Exceptional 2.0% |
Demographics Similar to Immigrants from Nepal by Vision Disability
In terms of vision disability, the demographic groups most similar to Immigrants from Nepal are Egyptian (1.9%, a difference of 0.040%), Immigrants from Malaysia (1.9%, a difference of 0.11%), Taiwanese (1.9%, a difference of 0.13%), Mongolian (1.9%, a difference of 0.17%), and Luxembourger (1.9%, a difference of 0.43%).
| Demographics | Rating | Rank | Vision Disability |
| Immigrants | Asia | 99.9 /100 | #23 | Exceptional 1.9% |
| Immigrants | Lithuania | 99.9 /100 | #24 | Exceptional 1.9% |
| Bulgarians | 99.9 /100 | #25 | Exceptional 1.9% |
| Immigrants | Japan | 99.9 /100 | #26 | Exceptional 1.9% |
| Taiwanese | 99.9 /100 | #27 | Exceptional 1.9% |
| Immigrants | Malaysia | 99.9 /100 | #28 | Exceptional 1.9% |
| Egyptians | 99.9 /100 | #29 | Exceptional 1.9% |
| Immigrants | Nepal | 99.9 /100 | #30 | Exceptional 1.9% |
| Mongolians | 99.9 /100 | #31 | Exceptional 1.9% |
| Luxembourgers | 99.9 /100 | #32 | Exceptional 1.9% |
| Immigrants | Egypt | 99.9 /100 | #33 | Exceptional 1.9% |
| Immigrants | Turkey | 99.8 /100 | #34 | Exceptional 1.9% |
| Immigrants | Australia | 99.8 /100 | #35 | Exceptional 1.9% |
| Cambodians | 99.8 /100 | #36 | Exceptional 2.0% |
| Bhutanese | 99.8 /100 | #37 | Exceptional 2.0% |