Lithuanian vs Slovene No Schooling Completed
COMPARE
Lithuanian
Slovene
No Schooling Completed
No Schooling Completed Comparison
Lithuanians
Slovenes
1.4%
NO SCHOOLING COMPLETED
100.0/ 100
METRIC RATING
11th/ 347
METRIC RANK
1.4%
NO SCHOOLING COMPLETED
100.0/ 100
METRIC RATING
5th/ 347
METRIC RANK
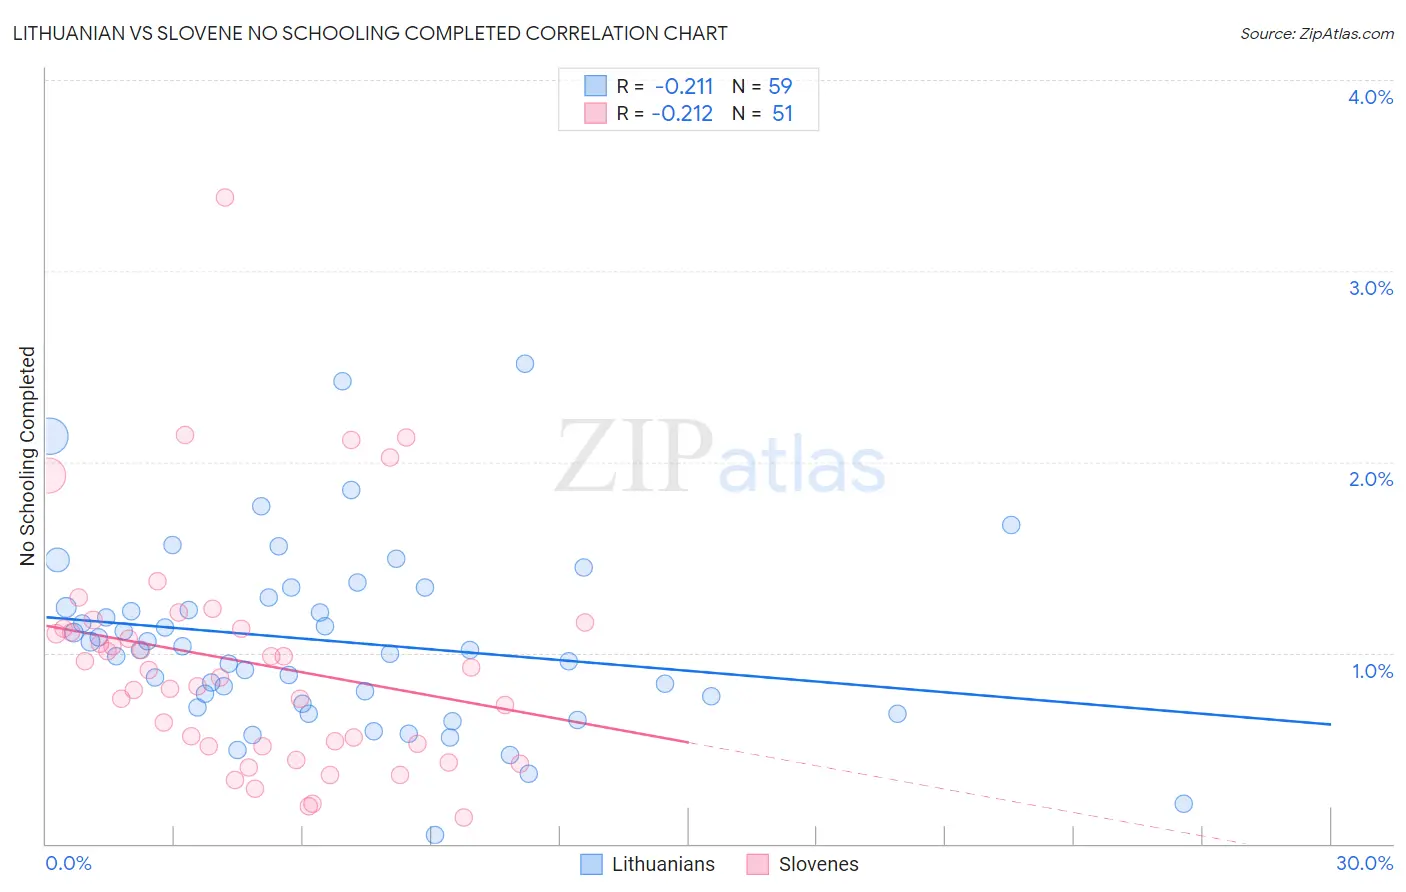
Lithuanian vs Slovene No Schooling Completed Correlation Chart
The statistical analysis conducted on geographies consisting of 415,193,435 people shows a weak negative correlation between the proportion of Lithuanians and percentage of population with no schooling in the United States with a correlation coefficient (R) of -0.211 and weighted average of 1.4%. Similarly, the statistical analysis conducted on geographies consisting of 258,600,541 people shows a weak negative correlation between the proportion of Slovenes and percentage of population with no schooling in the United States with a correlation coefficient (R) of -0.212 and weighted average of 1.4%, a difference of 5.6%.
No Schooling Completed Correlation Summary
| Measurement | Lithuanian | Slovene |
| Minimum | 0.047% | 0.14% |
| Maximum | 2.5% | 3.4% |
| Range | 2.5% | 3.2% |
| Mean | 1.1% | 0.95% |
| Median | 1.0% | 0.91% |
| Interquartile 25% (IQ1) | 0.74% | 0.51% |
| Interquartile 75% (IQ3) | 1.3% | 1.1% |
| Interquartile Range (IQR) | 0.55% | 0.62% |
| Standard Deviation (Sample) | 0.48% | 0.61% |
| Standard Deviation (Population) | 0.47% | 0.60% |
Demographics Similar to Lithuanians and Slovenes by No Schooling Completed
In terms of no schooling completed, the demographic groups most similar to Lithuanians are Irish (1.4%, a difference of 0.030%), Polish (1.4%, a difference of 0.050%), Dutch (1.4%, a difference of 0.84%), Scotch-Irish (1.5%, a difference of 1.0%), and Tlingit-Haida (1.5%, a difference of 1.1%). Similarly, the demographic groups most similar to Slovenes are German (1.4%, a difference of 0.42%), Carpatho Rusyn (1.4%, a difference of 0.82%), Norwegian (1.3%, a difference of 0.98%), Slovak (1.3%, a difference of 1.4%), and English (1.4%, a difference of 1.8%).
| Demographics | Rating | Rank | No Schooling Completed |
| Yup'ik | 100.0 /100 | #1 | Exceptional 1.2% |
| Slovaks | 100.0 /100 | #2 | Exceptional 1.3% |
| Norwegians | 100.0 /100 | #3 | Exceptional 1.3% |
| Germans | 100.0 /100 | #4 | Exceptional 1.4% |
| Slovenes | 100.0 /100 | #5 | Exceptional 1.4% |
| Carpatho Rusyns | 100.0 /100 | #6 | Exceptional 1.4% |
| English | 100.0 /100 | #7 | Exceptional 1.4% |
| Swedes | 100.0 /100 | #8 | Exceptional 1.4% |
| Scottish | 100.0 /100 | #9 | Exceptional 1.4% |
| Dutch | 100.0 /100 | #10 | Exceptional 1.4% |
| Lithuanians | 100.0 /100 | #11 | Exceptional 1.4% |
| Irish | 100.0 /100 | #12 | Exceptional 1.4% |
| Poles | 100.0 /100 | #13 | Exceptional 1.4% |
| Scotch-Irish | 100.0 /100 | #14 | Exceptional 1.5% |
| Tlingit-Haida | 100.0 /100 | #15 | Exceptional 1.5% |
| Finns | 100.0 /100 | #16 | Exceptional 1.5% |
| Croatians | 100.0 /100 | #17 | Exceptional 1.5% |
| Danes | 100.0 /100 | #18 | Exceptional 1.5% |
| Alaskan Athabascans | 100.0 /100 | #19 | Exceptional 1.5% |
| Welsh | 100.0 /100 | #20 | Exceptional 1.5% |