Lithuanian vs Immigrants from Italy No Schooling Completed
COMPARE
Lithuanian
Immigrants from Italy
No Schooling Completed
No Schooling Completed Comparison
Lithuanians
Immigrants from Italy
1.4%
NO SCHOOLING COMPLETED
100.0/ 100
METRIC RATING
11th/ 347
METRIC RANK
2.0%
NO SCHOOLING COMPLETED
68.9/ 100
METRIC RATING
153rd/ 347
METRIC RANK
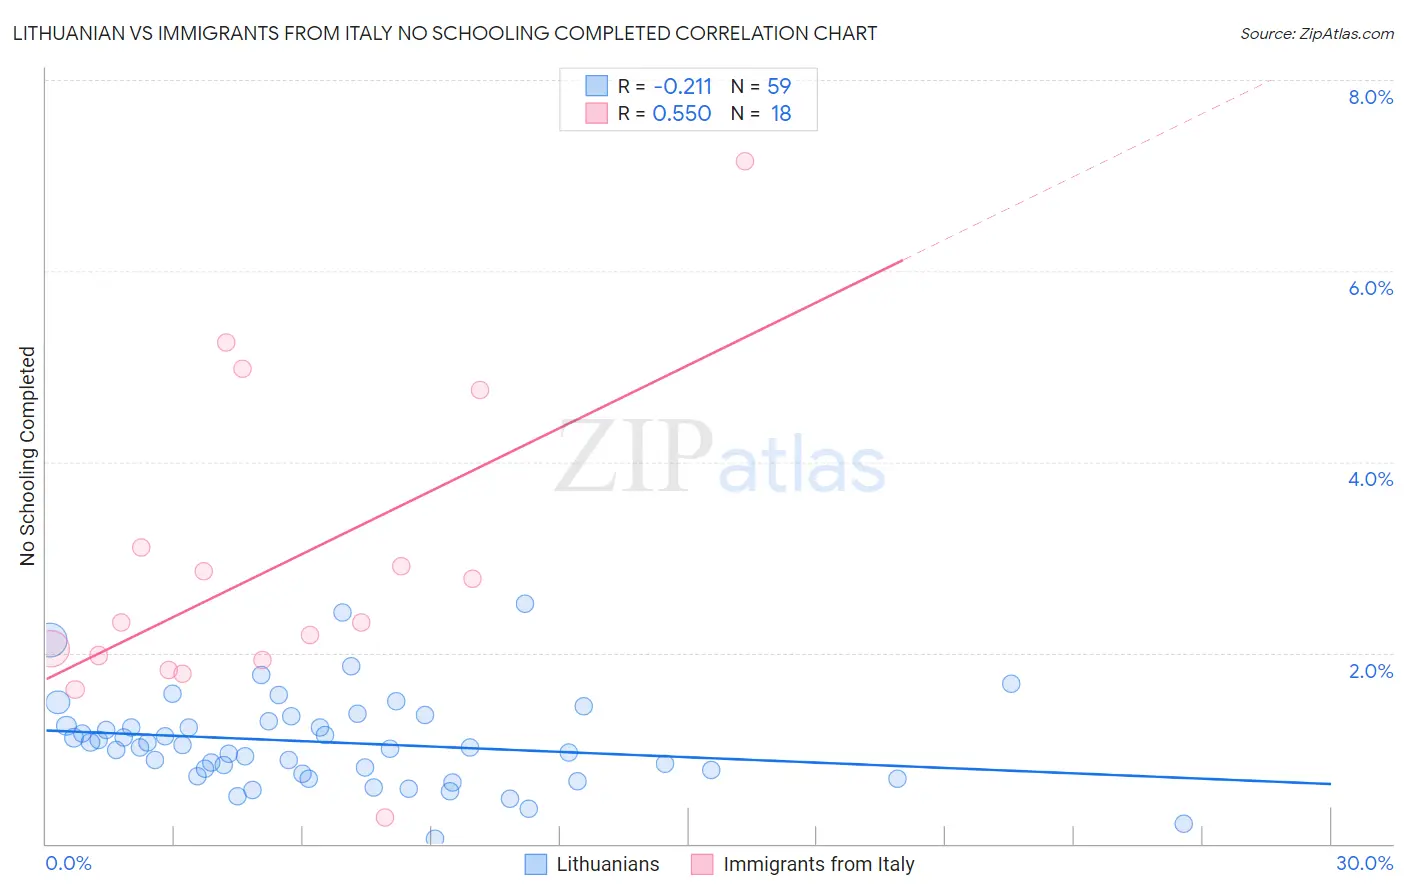
Lithuanian vs Immigrants from Italy No Schooling Completed Correlation Chart
The statistical analysis conducted on geographies consisting of 415,193,435 people shows a weak negative correlation between the proportion of Lithuanians and percentage of population with no schooling in the United States with a correlation coefficient (R) of -0.211 and weighted average of 1.4%. Similarly, the statistical analysis conducted on geographies consisting of 321,356,663 people shows a substantial positive correlation between the proportion of Immigrants from Italy and percentage of population with no schooling in the United States with a correlation coefficient (R) of 0.550 and weighted average of 2.0%, a difference of 41.6%.
No Schooling Completed Correlation Summary
| Measurement | Lithuanian | Immigrants from Italy |
| Minimum | 0.047% | 0.28% |
| Maximum | 2.5% | 7.1% |
| Range | 2.5% | 6.9% |
| Mean | 1.1% | 2.9% |
| Median | 1.0% | 2.3% |
| Interquartile 25% (IQ1) | 0.74% | 1.9% |
| Interquartile 75% (IQ3) | 1.3% | 3.1% |
| Interquartile Range (IQR) | 0.55% | 1.2% |
| Standard Deviation (Sample) | 0.48% | 1.6% |
| Standard Deviation (Population) | 0.47% | 1.6% |
Similar Demographics by No Schooling Completed
Demographics Similar to Lithuanians by No Schooling Completed
In terms of no schooling completed, the demographic groups most similar to Lithuanians are Irish (1.4%, a difference of 0.030%), Polish (1.4%, a difference of 0.050%), Dutch (1.4%, a difference of 0.84%), Scotch-Irish (1.5%, a difference of 1.0%), and Tlingit-Haida (1.5%, a difference of 1.1%).
| Demographics | Rating | Rank | No Schooling Completed |
| Germans | 100.0 /100 | #4 | Exceptional 1.4% |
| Slovenes | 100.0 /100 | #5 | Exceptional 1.4% |
| Carpatho Rusyns | 100.0 /100 | #6 | Exceptional 1.4% |
| English | 100.0 /100 | #7 | Exceptional 1.4% |
| Swedes | 100.0 /100 | #8 | Exceptional 1.4% |
| Scottish | 100.0 /100 | #9 | Exceptional 1.4% |
| Dutch | 100.0 /100 | #10 | Exceptional 1.4% |
| Lithuanians | 100.0 /100 | #11 | Exceptional 1.4% |
| Irish | 100.0 /100 | #12 | Exceptional 1.4% |
| Poles | 100.0 /100 | #13 | Exceptional 1.4% |
| Scotch-Irish | 100.0 /100 | #14 | Exceptional 1.5% |
| Tlingit-Haida | 100.0 /100 | #15 | Exceptional 1.5% |
| Finns | 100.0 /100 | #16 | Exceptional 1.5% |
| Croatians | 100.0 /100 | #17 | Exceptional 1.5% |
| Danes | 100.0 /100 | #18 | Exceptional 1.5% |
Demographics Similar to Immigrants from Italy by No Schooling Completed
In terms of no schooling completed, the demographic groups most similar to Immigrants from Italy are Immigrants from Venezuela (2.0%, a difference of 0.060%), Immigrants from Russia (2.0%, a difference of 0.20%), Immigrants from Eastern Europe (2.0%, a difference of 0.24%), Chilean (2.0%, a difference of 0.27%), and Immigrants from Sri Lanka (2.0%, a difference of 0.30%).
| Demographics | Rating | Rank | No Schooling Completed |
| Immigrants | Moldova | 78.0 /100 | #146 | Good 2.0% |
| Soviet Union | 77.1 /100 | #147 | Good 2.0% |
| Shoshone | 76.7 /100 | #148 | Good 2.0% |
| Immigrants | North Macedonia | 75.9 /100 | #149 | Good 2.0% |
| Blackfeet | 72.9 /100 | #150 | Good 2.0% |
| Immigrants | Jordan | 70.9 /100 | #151 | Good 2.0% |
| Immigrants | Eastern Europe | 70.4 /100 | #152 | Good 2.0% |
| Immigrants | Italy | 68.9 /100 | #153 | Good 2.0% |
| Immigrants | Venezuela | 68.5 /100 | #154 | Good 2.0% |
| Immigrants | Russia | 67.6 /100 | #155 | Good 2.0% |
| Chileans | 67.2 /100 | #156 | Good 2.0% |
| Immigrants | Sri Lanka | 67.0 /100 | #157 | Good 2.0% |
| Immigrants | Korea | 66.7 /100 | #158 | Good 2.0% |
| Immigrants | Spain | 66.4 /100 | #159 | Good 2.0% |
| Kenyans | 65.7 /100 | #160 | Good 2.0% |