Lithuanian vs Honduran No Schooling Completed
COMPARE
Lithuanian
Honduran
No Schooling Completed
No Schooling Completed Comparison
Lithuanians
Hondurans
1.4%
NO SCHOOLING COMPLETED
100.0/ 100
METRIC RATING
11th/ 347
METRIC RANK
3.1%
NO SCHOOLING COMPLETED
0.0/ 100
METRIC RATING
313th/ 347
METRIC RANK
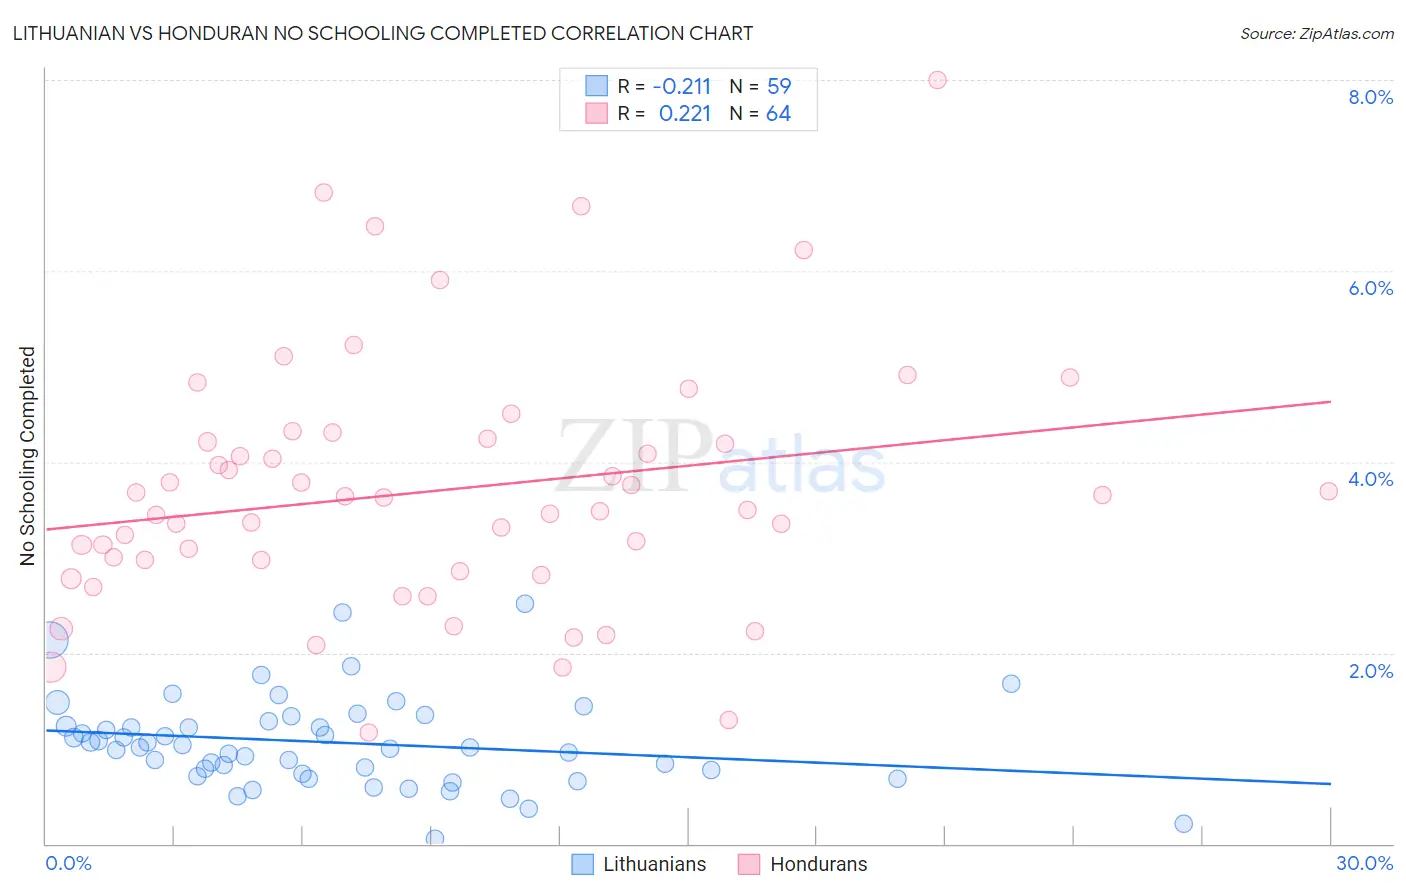
Lithuanian vs Honduran No Schooling Completed Correlation Chart
The statistical analysis conducted on geographies consisting of 415,193,435 people shows a weak negative correlation between the proportion of Lithuanians and percentage of population with no schooling in the United States with a correlation coefficient (R) of -0.211 and weighted average of 1.4%. Similarly, the statistical analysis conducted on geographies consisting of 355,822,203 people shows a weak positive correlation between the proportion of Hondurans and percentage of population with no schooling in the United States with a correlation coefficient (R) of 0.221 and weighted average of 3.1%, a difference of 113.2%.
No Schooling Completed Correlation Summary
| Measurement | Lithuanian | Honduran |
| Minimum | 0.047% | 1.2% |
| Maximum | 2.5% | 8.0% |
| Range | 2.5% | 6.8% |
| Mean | 1.1% | 3.7% |
| Median | 1.0% | 3.6% |
| Interquartile 25% (IQ1) | 0.74% | 2.9% |
| Interquartile 75% (IQ3) | 1.3% | 4.2% |
| Interquartile Range (IQR) | 0.55% | 1.3% |
| Standard Deviation (Sample) | 0.48% | 1.3% |
| Standard Deviation (Population) | 0.47% | 1.3% |
Similar Demographics by No Schooling Completed
Demographics Similar to Lithuanians by No Schooling Completed
In terms of no schooling completed, the demographic groups most similar to Lithuanians are Irish (1.4%, a difference of 0.030%), Polish (1.4%, a difference of 0.050%), Dutch (1.4%, a difference of 0.84%), Scotch-Irish (1.5%, a difference of 1.0%), and Tlingit-Haida (1.5%, a difference of 1.1%).
| Demographics | Rating | Rank | No Schooling Completed |
| Germans | 100.0 /100 | #4 | Exceptional 1.4% |
| Slovenes | 100.0 /100 | #5 | Exceptional 1.4% |
| Carpatho Rusyns | 100.0 /100 | #6 | Exceptional 1.4% |
| English | 100.0 /100 | #7 | Exceptional 1.4% |
| Swedes | 100.0 /100 | #8 | Exceptional 1.4% |
| Scottish | 100.0 /100 | #9 | Exceptional 1.4% |
| Dutch | 100.0 /100 | #10 | Exceptional 1.4% |
| Lithuanians | 100.0 /100 | #11 | Exceptional 1.4% |
| Irish | 100.0 /100 | #12 | Exceptional 1.4% |
| Poles | 100.0 /100 | #13 | Exceptional 1.4% |
| Scotch-Irish | 100.0 /100 | #14 | Exceptional 1.5% |
| Tlingit-Haida | 100.0 /100 | #15 | Exceptional 1.5% |
| Finns | 100.0 /100 | #16 | Exceptional 1.5% |
| Croatians | 100.0 /100 | #17 | Exceptional 1.5% |
| Danes | 100.0 /100 | #18 | Exceptional 1.5% |
Demographics Similar to Hondurans by No Schooling Completed
In terms of no schooling completed, the demographic groups most similar to Hondurans are Immigrants from Belize (3.1%, a difference of 0.090%), Immigrants from Nicaragua (3.1%, a difference of 0.33%), Sri Lankan (3.0%, a difference of 0.51%), Immigrants from Ecuador (3.1%, a difference of 0.69%), and Immigrants from the Azores (3.0%, a difference of 0.79%).
| Demographics | Rating | Rank | No Schooling Completed |
| Belizeans | 0.0 /100 | #306 | Tragic 3.0% |
| Immigrants | Haiti | 0.0 /100 | #307 | Tragic 3.0% |
| Immigrants | Somalia | 0.0 /100 | #308 | Tragic 3.0% |
| Hispanics or Latinos | 0.0 /100 | #309 | Tragic 3.0% |
| Guyanese | 0.0 /100 | #310 | Tragic 3.0% |
| Immigrants | Azores | 0.0 /100 | #311 | Tragic 3.0% |
| Sri Lankans | 0.0 /100 | #312 | Tragic 3.0% |
| Hondurans | 0.0 /100 | #313 | Tragic 3.1% |
| Immigrants | Belize | 0.0 /100 | #314 | Tragic 3.1% |
| Immigrants | Nicaragua | 0.0 /100 | #315 | Tragic 3.1% |
| Immigrants | Ecuador | 0.0 /100 | #316 | Tragic 3.1% |
| Cape Verdeans | 0.0 /100 | #317 | Tragic 3.1% |
| Immigrants | Guyana | 0.0 /100 | #318 | Tragic 3.1% |
| Immigrants | Burma/Myanmar | 0.0 /100 | #319 | Tragic 3.1% |
| Immigrants | Bangladesh | 0.0 /100 | #320 | Tragic 3.1% |