Argentinean vs Cree No Schooling Completed
COMPARE
Argentinean
Cree
No Schooling Completed
No Schooling Completed Comparison
Argentineans
Cree
2.1%
NO SCHOOLING COMPLETED
56.0/ 100
METRIC RATING
170th/ 347
METRIC RANK
1.9%
NO SCHOOLING COMPLETED
94.5/ 100
METRIC RATING
122nd/ 347
METRIC RANK
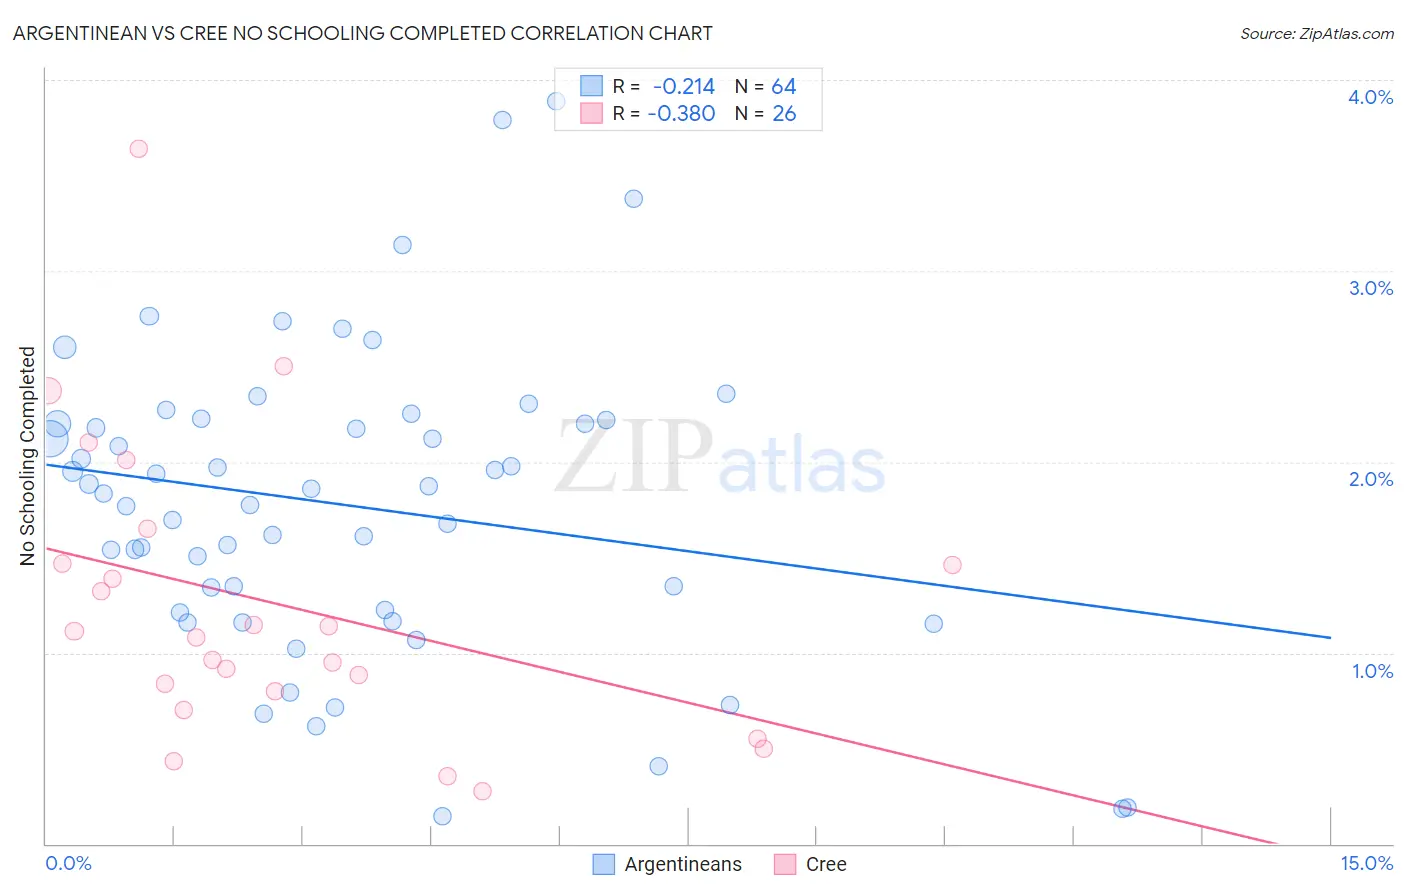
Argentinean vs Cree No Schooling Completed Correlation Chart
The statistical analysis conducted on geographies consisting of 295,019,263 people shows a weak negative correlation between the proportion of Argentineans and percentage of population with no schooling in the United States with a correlation coefficient (R) of -0.214 and weighted average of 2.1%. Similarly, the statistical analysis conducted on geographies consisting of 75,913,844 people shows a mild negative correlation between the proportion of Cree and percentage of population with no schooling in the United States with a correlation coefficient (R) of -0.380 and weighted average of 1.9%, a difference of 9.6%.
No Schooling Completed Correlation Summary
| Measurement | Argentinean | Cree |
| Minimum | 0.14% | 0.28% |
| Maximum | 3.9% | 3.6% |
| Range | 3.7% | 3.4% |
| Mean | 1.8% | 1.3% |
| Median | 1.8% | 1.1% |
| Interquartile 25% (IQ1) | 1.2% | 0.80% |
| Interquartile 75% (IQ3) | 2.2% | 1.5% |
| Interquartile Range (IQR) | 0.99% | 0.67% |
| Standard Deviation (Sample) | 0.79% | 0.77% |
| Standard Deviation (Population) | 0.79% | 0.75% |
Similar Demographics by No Schooling Completed
Demographics Similar to Argentineans by No Schooling Completed
In terms of no schooling completed, the demographic groups most similar to Argentineans are Apache (2.1%, a difference of 0.090%), Immigrants from Poland (2.1%, a difference of 0.11%), Cheyenne (2.1%, a difference of 0.36%), Egyptian (2.1%, a difference of 0.44%), and Immigrants from Argentina (2.1%, a difference of 0.45%).
| Demographics | Rating | Rank | No Schooling Completed |
| Albanians | 62.2 /100 | #163 | Good 2.1% |
| Comanche | 60.7 /100 | #164 | Good 2.1% |
| Brazilians | 60.2 /100 | #165 | Good 2.1% |
| Dutch West Indians | 59.9 /100 | #166 | Average 2.1% |
| Egyptians | 59.2 /100 | #167 | Average 2.1% |
| Cheyenne | 58.6 /100 | #168 | Average 2.1% |
| Apache | 56.7 /100 | #169 | Average 2.1% |
| Argentineans | 56.0 /100 | #170 | Average 2.1% |
| Immigrants | Poland | 55.2 /100 | #171 | Average 2.1% |
| Immigrants | Argentina | 52.7 /100 | #172 | Average 2.1% |
| Immigrants | Belarus | 51.8 /100 | #173 | Average 2.1% |
| Immigrants | Micronesia | 50.0 /100 | #174 | Average 2.1% |
| Arabs | 46.4 /100 | #175 | Average 2.1% |
| Panamanians | 45.2 /100 | #176 | Average 2.1% |
| Arapaho | 45.0 /100 | #177 | Average 2.1% |
Demographics Similar to Cree by No Schooling Completed
In terms of no schooling completed, the demographic groups most similar to Cree are Immigrants from Croatia (1.9%, a difference of 0.030%), Immigrants from Bulgaria (1.9%, a difference of 0.090%), Immigrants from Kuwait (1.9%, a difference of 0.36%), Cambodian (1.9%, a difference of 0.44%), and Iroquois (1.9%, a difference of 0.50%).
| Demographics | Rating | Rank | No Schooling Completed |
| Syrians | 96.0 /100 | #115 | Exceptional 1.9% |
| Lebanese | 96.0 /100 | #116 | Exceptional 1.9% |
| Immigrants | Serbia | 95.8 /100 | #117 | Exceptional 1.9% |
| Spanish | 95.5 /100 | #118 | Exceptional 1.9% |
| Iroquois | 95.1 /100 | #119 | Exceptional 1.9% |
| Immigrants | Bulgaria | 94.6 /100 | #120 | Exceptional 1.9% |
| Immigrants | Croatia | 94.5 /100 | #121 | Exceptional 1.9% |
| Cree | 94.5 /100 | #122 | Exceptional 1.9% |
| Immigrants | Kuwait | 93.9 /100 | #123 | Exceptional 1.9% |
| Cambodians | 93.8 /100 | #124 | Exceptional 1.9% |
| Immigrants | Europe | 93.7 /100 | #125 | Exceptional 1.9% |
| Immigrants | Romania | 92.6 /100 | #126 | Exceptional 1.9% |
| Israelis | 92.4 /100 | #127 | Exceptional 1.9% |
| Spaniards | 92.3 /100 | #128 | Exceptional 1.9% |
| Seminole | 92.0 /100 | #129 | Exceptional 1.9% |