Lithuanian vs Immigrants from Netherlands No Schooling Completed
COMPARE
Lithuanian
Immigrants from Netherlands
No Schooling Completed
No Schooling Completed Comparison
Lithuanians
Immigrants from Netherlands
1.4%
NO SCHOOLING COMPLETED
100.0/ 100
METRIC RATING
11th/ 347
METRIC RANK
1.7%
NO SCHOOLING COMPLETED
99.6/ 100
METRIC RATING
70th/ 347
METRIC RANK
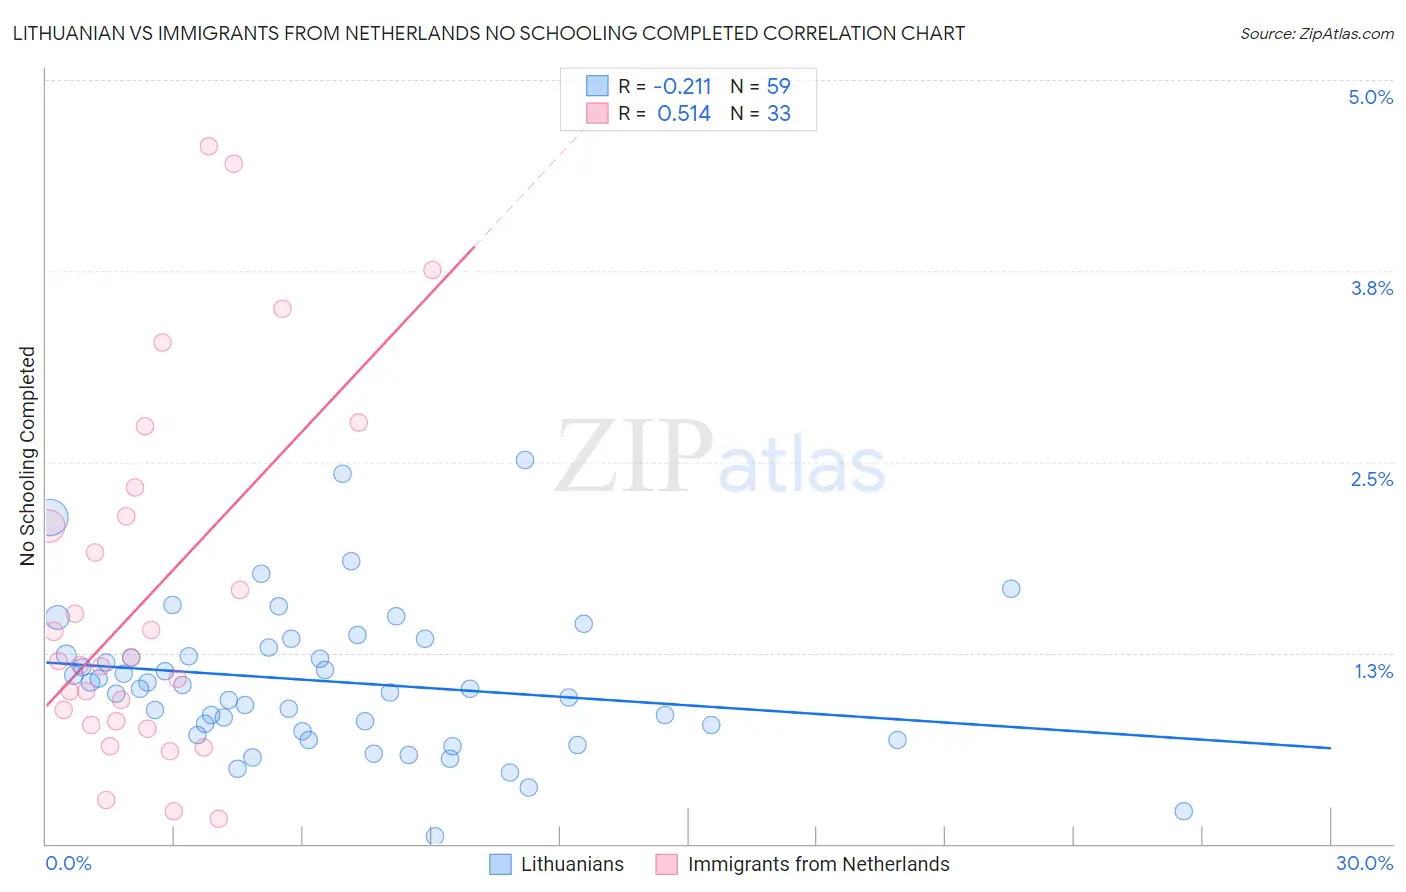
Lithuanian vs Immigrants from Netherlands No Schooling Completed Correlation Chart
The statistical analysis conducted on geographies consisting of 415,193,435 people shows a weak negative correlation between the proportion of Lithuanians and percentage of population with no schooling in the United States with a correlation coefficient (R) of -0.211 and weighted average of 1.4%. Similarly, the statistical analysis conducted on geographies consisting of 236,079,669 people shows a substantial positive correlation between the proportion of Immigrants from Netherlands and percentage of population with no schooling in the United States with a correlation coefficient (R) of 0.514 and weighted average of 1.7%, a difference of 19.1%.
No Schooling Completed Correlation Summary
| Measurement | Lithuanian | Immigrants from Netherlands |
| Minimum | 0.047% | 0.16% |
| Maximum | 2.5% | 4.6% |
| Range | 2.5% | 4.4% |
| Mean | 1.1% | 1.6% |
| Median | 1.0% | 1.2% |
| Interquartile 25% (IQ1) | 0.74% | 0.79% |
| Interquartile 75% (IQ3) | 1.3% | 2.2% |
| Interquartile Range (IQR) | 0.55% | 1.4% |
| Standard Deviation (Sample) | 0.48% | 1.2% |
| Standard Deviation (Population) | 0.47% | 1.2% |
Similar Demographics by No Schooling Completed
Demographics Similar to Lithuanians by No Schooling Completed
In terms of no schooling completed, the demographic groups most similar to Lithuanians are Irish (1.4%, a difference of 0.030%), Polish (1.4%, a difference of 0.050%), Dutch (1.4%, a difference of 0.84%), Scotch-Irish (1.5%, a difference of 1.0%), and Tlingit-Haida (1.5%, a difference of 1.1%).
| Demographics | Rating | Rank | No Schooling Completed |
| Germans | 100.0 /100 | #4 | Exceptional 1.4% |
| Slovenes | 100.0 /100 | #5 | Exceptional 1.4% |
| Carpatho Rusyns | 100.0 /100 | #6 | Exceptional 1.4% |
| English | 100.0 /100 | #7 | Exceptional 1.4% |
| Swedes | 100.0 /100 | #8 | Exceptional 1.4% |
| Scottish | 100.0 /100 | #9 | Exceptional 1.4% |
| Dutch | 100.0 /100 | #10 | Exceptional 1.4% |
| Lithuanians | 100.0 /100 | #11 | Exceptional 1.4% |
| Irish | 100.0 /100 | #12 | Exceptional 1.4% |
| Poles | 100.0 /100 | #13 | Exceptional 1.4% |
| Scotch-Irish | 100.0 /100 | #14 | Exceptional 1.5% |
| Tlingit-Haida | 100.0 /100 | #15 | Exceptional 1.5% |
| Finns | 100.0 /100 | #16 | Exceptional 1.5% |
| Croatians | 100.0 /100 | #17 | Exceptional 1.5% |
| Danes | 100.0 /100 | #18 | Exceptional 1.5% |
Demographics Similar to Immigrants from Netherlands by No Schooling Completed
In terms of no schooling completed, the demographic groups most similar to Immigrants from Netherlands are Immigrants from England (1.7%, a difference of 0.34%), Cajun (1.7%, a difference of 0.51%), Chickasaw (1.7%, a difference of 0.97%), Immigrants from India (1.7%, a difference of 1.0%), and Zimbabwean (1.7%, a difference of 1.0%).
| Demographics | Rating | Rank | No Schooling Completed |
| Russians | 99.8 /100 | #63 | Exceptional 1.7% |
| New Zealanders | 99.7 /100 | #64 | Exceptional 1.7% |
| Serbians | 99.7 /100 | #65 | Exceptional 1.7% |
| Canadians | 99.7 /100 | #66 | Exceptional 1.7% |
| Immigrants | Austria | 99.7 /100 | #67 | Exceptional 1.7% |
| Immigrants | Lithuania | 99.7 /100 | #68 | Exceptional 1.7% |
| Chickasaw | 99.6 /100 | #69 | Exceptional 1.7% |
| Immigrants | Netherlands | 99.6 /100 | #70 | Exceptional 1.7% |
| Immigrants | England | 99.5 /100 | #71 | Exceptional 1.7% |
| Cajuns | 99.5 /100 | #72 | Exceptional 1.7% |
| Immigrants | India | 99.4 /100 | #73 | Exceptional 1.7% |
| Zimbabweans | 99.4 /100 | #74 | Exceptional 1.7% |
| Immigrants | Belgium | 99.3 /100 | #75 | Exceptional 1.7% |
| Cherokee | 99.3 /100 | #76 | Exceptional 1.7% |
| Immigrants | Sweden | 99.3 /100 | #77 | Exceptional 1.7% |