Lebanese vs Cree No Schooling Completed

COMPARE

Lebanese
Race
Ancestry
AfghanAfricanAlaska NativeAlaskan AthabascanAlbanianAleutAlsatianAmericanApacheArabArapahoArgentineanArmenianAssyrian/Chaldean/SyriacAustralianAustrianBahamianBangladeshiBarbadianBasqueBelgianBelizeanBermudanBhutaneseBlackfeetBolivianBrazilianBritishBritish West IndianBulgarianBurmeseCajunCambodianCanadianCape VerdeanCarpatho RusynCelticCentral AmericanCentral American IndianCherokeeCheyenneChickasawChileanChineseChippewaChoctawColombianColvilleComancheCosta RicanCreekCroatianCrowCubanCypriotCzechCzechoslovakianDanishDelawareDominicanDutchDutch West IndianEastern EuropeanEcuadorianEgyptianEnglishEstonianEthiopianEuropeanFijianFilipinoFinnishFrenchFrench American IndianFrench CanadianGermanGerman RussianGhanaianGreekGuamanian/ChamorroGuatemalanGuyaneseHaitianHmongHonduranHopiHoumaHungarianIcelanderIndian (Asian)IndonesianInupiatIranianIraqiIrishIroquoisIsraeliItalianJamaicanJapaneseJordanianKenyanKiowaKoreanLaotianLatvianLebaneseLiberianLithuanianLumbeeLuxembourgerMacedonianMalaysianMalteseMarshalleseMenomineeMexicanMexican American IndianMongolianMoroccanNative HawaiianNavajoNepaleseNew ZealanderNicaraguanNigerianNorthern EuropeanNorwegianOkinawanOsageOttawaPaiutePakistaniPalestinianPanamanianParaguayanPennsylvania GermanPeruvianPimaPolishPortuguesePotawatomiPuebloPuerto RicanPuget Sound SalishRomanianRussianSalvadoranSamoanScandinavianScotch-IrishScottishSeminoleSenegaleseSerbianShoshoneSierra LeoneanSiouxSlavicSlovakSloveneSomaliSouth AfricanSouth AmericanSouth American IndianSoviet UnionSpaniardSpanishSpanish AmericanSpanish American IndianSri LankanSubsaharan AfricanSudaneseSwedishSwissSyrianTaiwaneseThaiTlingit-HaidaTohono O'OdhamTonganTrinidadian and TobagonianTsimshianTurkishU.S. Virgin IslanderUgandanUkrainianUruguayanUteVenezuelanVietnameseWelshWest IndianYakamaYaquiYugoslavianYumanYup'ikZimbabwean
Immigration
NonimmigrantsImmigrantsAfghanistanAfricaAlbaniaArgentinaArmeniaAsiaAustraliaAustriaBahamasBangladeshBarbadosBelarusBelgiumBelizeBoliviaBosnia and HerzegovinaBrazilBulgariaBurma/MyanmarCabo VerdeCambodiaCameroonCanadaCaribbeanCentral AmericaChileChinaColombiaCongoCosta RicaCroatiaCubaCzechoslovakiaDenmarkDominicaDominican RepublicEastern AfricaEastern AsiaEastern EuropeEcuadorEgyptEl SalvadorEnglandEritreaEthiopiaEuropeFijiFranceGermanyGhanaGreeceGrenadaGuatemalaGuyanaHaitiHondurasHong KongHungaryIndiaIndonesiaIranIraqIrelandIsraelItalyJamaicaJapanJordanKazakhstanKenyaKoreaKuwaitLaosLatin AmericaLatviaLebanonLiberiaLithuaniaMalaysiaMexicoMicronesiaMiddle AfricaMoldovaMoroccoNepalNetherlandsNicaraguaNigeriaNorth AmericaNorth MacedoniaNorthern AfricaNorthern EuropeNorwayOceaniaPakistanPanamaPeruPhilippinesPolandPortugalRomaniaRussiaSaudi ArabiaScotlandSenegalSerbiaSierra LeoneSingaporeSomaliaSouth AfricaSouth AmericaSouth Central AsiaSouth Eastern AsiaSouthern EuropeSpainSri LankaSt. Vincent and the GrenadinesSudanSwedenSwitzerlandSyriaTaiwanThailandTrinidad and TobagoTurkeyUgandaUkraineUruguayUzbekistanVenezuelaVietnamWest IndiesWestern AfricaWestern AsiaWestern EuropeYemenZaireZimbabweAzores
Cree
Race
Ancestry
AfghanAfricanAlaska NativeAlaskan AthabascanAlbanianAleutAlsatianAmericanApacheArabArapahoArgentineanArmenianAssyrian/Chaldean/SyriacAustralianAustrianBahamianBangladeshiBarbadianBasqueBelgianBelizeanBermudanBhutaneseBlackfeetBolivianBrazilianBritishBritish West IndianBulgarianBurmeseCajunCambodianCanadianCape VerdeanCarpatho RusynCelticCentral AmericanCentral American IndianCherokeeCheyenneChickasawChileanChineseChippewaChoctawColombianColvilleComancheCosta RicanCreeCreekCroatianCrowCubanCypriotCzechCzechoslovakianDanishDelawareDominicanDutchDutch West IndianEastern EuropeanEcuadorianEgyptianEnglishEstonianEthiopianEuropeanFijianFilipinoFinnishFrenchFrench American IndianFrench CanadianGermanGerman RussianGhanaianGreekGuamanian/ChamorroGuatemalanGuyaneseHaitianHmongHonduranHopiHoumaHungarianIcelanderIndian (Asian)IndonesianInupiatIranianIraqiIrishIroquoisIsraeliItalianJamaicanJapaneseJordanianKenyanKiowaKoreanLaotianLatvianLiberianLithuanianLumbeeLuxembourgerMacedonianMalaysianMalteseMarshalleseMenomineeMexicanMexican American IndianMongolianMoroccanNative HawaiianNavajoNepaleseNew ZealanderNicaraguanNigerianNorthern EuropeanNorwegianOkinawanOsageOttawaPaiutePakistaniPalestinianPanamanianParaguayanPennsylvania GermanPeruvianPimaPolishPortuguesePotawatomiPuebloPuerto RicanPuget Sound SalishRomanianRussianSalvadoranSamoanScandinavianScotch-IrishScottishSeminoleSenegaleseSerbianShoshoneSierra LeoneanSiouxSlavicSlovakSloveneSomaliSouth AfricanSouth AmericanSouth American IndianSoviet UnionSpaniardSpanishSpanish AmericanSpanish American IndianSri LankanSubsaharan AfricanSudaneseSwedishSwissSyrianTaiwaneseThaiTlingit-HaidaTohono O'OdhamTonganTrinidadian and TobagonianTsimshianTurkishU.S. Virgin IslanderUgandanUkrainianUruguayanUteVenezuelanVietnameseWelshWest IndianYakamaYaquiYugoslavianYumanYup'ikZimbabwean
Immigration
NonimmigrantsImmigrantsAfghanistanAfricaAlbaniaArgentinaArmeniaAsiaAustraliaAustriaBahamasBangladeshBarbadosBelarusBelgiumBelizeBoliviaBosnia and HerzegovinaBrazilBulgariaBurma/MyanmarCabo VerdeCambodiaCameroonCanadaCaribbeanCentral AmericaChileChinaColombiaCongoCosta RicaCroatiaCubaCzechoslovakiaDenmarkDominicaDominican RepublicEastern AfricaEastern AsiaEastern EuropeEcuadorEgyptEl SalvadorEnglandEritreaEthiopiaEuropeFijiFranceGermanyGhanaGreeceGrenadaGuatemalaGuyanaHaitiHondurasHong KongHungaryIndiaIndonesiaIranIraqIrelandIsraelItalyJamaicaJapanJordanKazakhstanKenyaKoreaKuwaitLaosLatin AmericaLatviaLebanonLiberiaLithuaniaMalaysiaMexicoMicronesiaMiddle AfricaMoldovaMoroccoNepalNetherlandsNicaraguaNigeriaNorth AmericaNorth MacedoniaNorthern AfricaNorthern EuropeNorwayOceaniaPakistanPanamaPeruPhilippinesPolandPortugalRomaniaRussiaSaudi ArabiaScotlandSenegalSerbiaSierra LeoneSingaporeSomaliaSouth AfricaSouth AmericaSouth Central AsiaSouth Eastern AsiaSouthern EuropeSpainSri LankaSt. Vincent and the GrenadinesSudanSwedenSwitzerlandSyriaTaiwanThailandTrinidad and TobagoTurkeyUgandaUkraineUruguayUzbekistanVenezuelaVietnamWest IndiesWestern AfricaWestern AsiaWestern EuropeYemenZaireZimbabweAzores
No Schooling Completed
Income
Poverty
Unemployment
Labor Participation
Family Structure
Vehicle Availability
Education Level
Disability

No Schooling Completed Comparison

Lebanese

Cree

Exceptional
Exceptional
1.9%
NO SCHOOLING COMPLETED
96.0/ 100
METRIC RATING
116th/ 347
METRIC RANK
1.9%
NO SCHOOLING COMPLETED
94.5/ 100
METRIC RATING
122nd/ 347
METRIC RANK

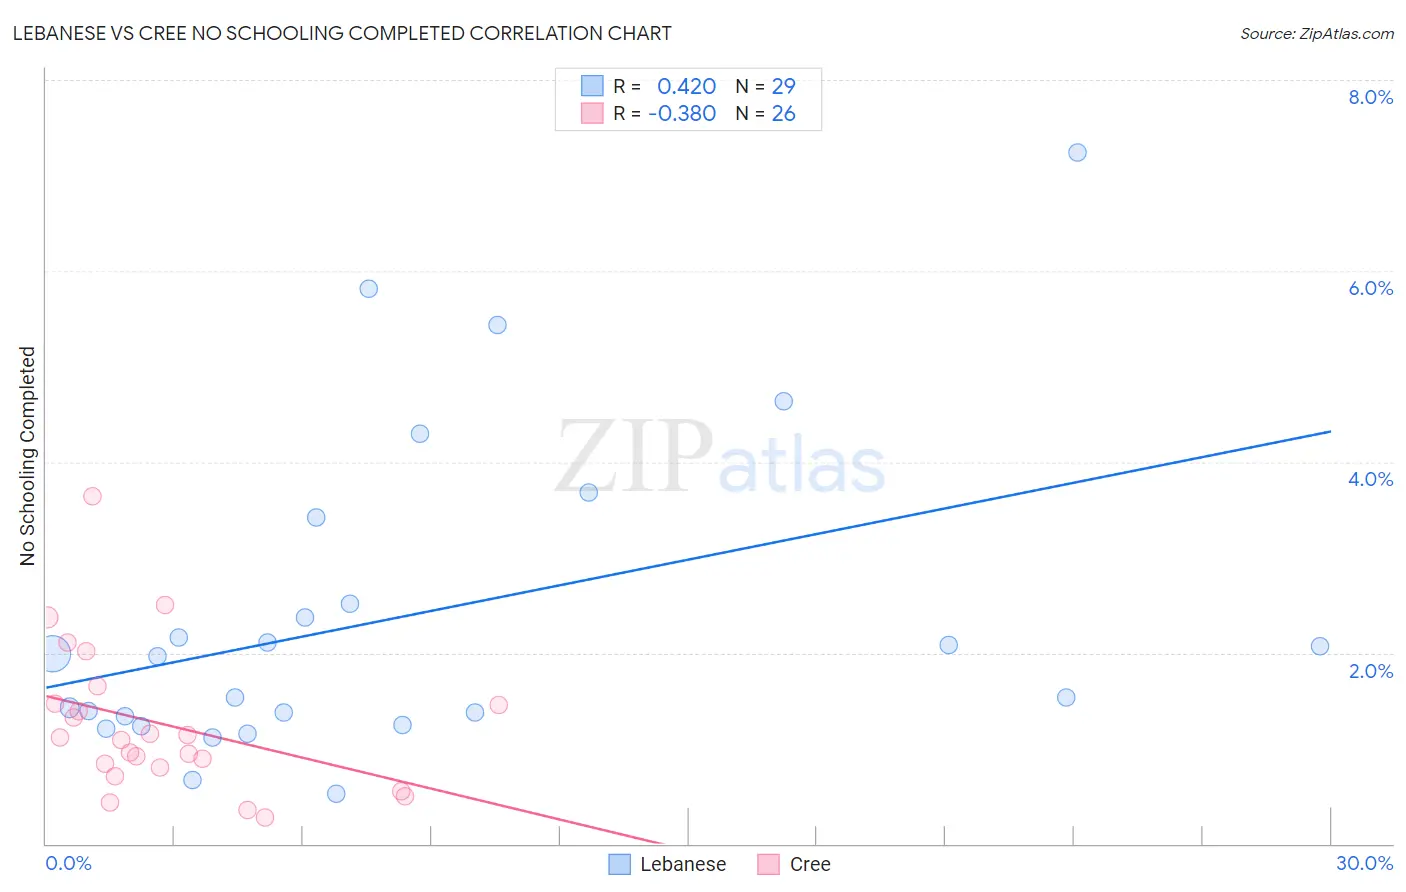
Lebanese vs Cree No Schooling Completed Correlation Chart

The statistical analysis conducted on geographies consisting of 396,753,431 people shows a moderate positive correlation between the proportion of Lebanese and percentage of population with no schooling in the United States with a correlation coefficient (R) of 0.420 and weighted average of 1.9%. Similarly, the statistical analysis conducted on geographies consisting of 75,913,844 people shows a mild negative correlation between the proportion of Cree and percentage of population with no schooling in the United States with a correlation coefficient (R) of -0.380 and weighted average of 1.9%, a difference of 1.3%.
Lebanese vs Cree No Schooling Completed

No Schooling Completed Correlation Summary

MeasurementLebaneseCree
Minimum0.52%0.28%
Maximum7.2%3.6%
Range6.7%3.4%
Mean2.4%1.3%
Median2.0%1.1%
Interquartile 25% (IQ1)1.3%0.80%
Interquartile 75% (IQ3)3.0%1.5%
Interquartile Range (IQR)1.7%0.67%
Standard Deviation (Sample)1.7%0.77%
Standard Deviation (Population)1.6%0.75%

Demographics Similar to Lebanese and Cree by No Schooling Completed

In terms of no schooling completed, the demographic groups most similar to Lebanese are Syrian (1.9%, a difference of 0.020%), Immigrants from Norway (1.9%, a difference of 0.15%), Immigrants from Zimbabwe (1.9%, a difference of 0.16%), Immigrants from Serbia (1.9%, a difference of 0.20%), and Pueblo (1.9%, a difference of 0.41%). Similarly, the demographic groups most similar to Cree are Immigrants from Croatia (1.9%, a difference of 0.030%), Immigrants from Bulgaria (1.9%, a difference of 0.090%), Immigrants from Kuwait (1.9%, a difference of 0.36%), Cambodian (1.9%, a difference of 0.44%), and Iroquois (1.9%, a difference of 0.50%).
DemographicsRating | RankNo Schooling Completed
Immigrants | Saudi Arabia
96.8
/100
|
#109
Exceptional
1.9%
Immigrants | Latvia
96.7
/100
|
#110
Exceptional
1.9%
Immigrants | Japan
96.6
/100
|
#111
Exceptional
1.9%
Pueblo
96.4
/100
|
#112
Exceptional
1.9%
Immigrants | Zimbabwe
96.2
/100
|
#113
Exceptional
1.9%
Immigrants | Norway
96.1
/100
|
#114
Exceptional
1.9%
Syrians
96.0
/100
|
#115
Exceptional
1.9%
Lebanese
96.0
/100
|
#116
Exceptional
1.9%
Immigrants | Serbia
95.8
/100
|
#117
Exceptional
1.9%
Spanish
95.5
/100
|
#118
Exceptional
1.9%
Iroquois
95.1
/100
|
#119
Exceptional
1.9%
Immigrants | Bulgaria
94.6
/100
|
#120
Exceptional
1.9%
Immigrants | Croatia
94.5
/100
|
#121
Exceptional
1.9%
Cree
94.5
/100
|
#122
Exceptional
1.9%
Immigrants | Kuwait
93.9
/100
|
#123
Exceptional
1.9%
Cambodians
93.8
/100
|
#124
Exceptional
1.9%
Immigrants | Europe
93.7
/100
|
#125
Exceptional
1.9%
Immigrants | Romania
92.6
/100
|
#126
Exceptional
1.9%
Israelis
92.4
/100
|
#127
Exceptional
1.9%
Spaniards
92.3
/100
|
#128
Exceptional
1.9%
Seminole
92.0
/100
|
#129
Exceptional
1.9%