Lithuanian vs Immigrants from Guatemala No Schooling Completed
COMPARE
Lithuanian
Immigrants from Guatemala
No Schooling Completed
No Schooling Completed Comparison
Lithuanians
Immigrants from Guatemala
1.4%
NO SCHOOLING COMPLETED
100.0/ 100
METRIC RATING
11th/ 347
METRIC RANK
3.6%
NO SCHOOLING COMPLETED
0.0/ 100
METRIC RATING
340th/ 347
METRIC RANK
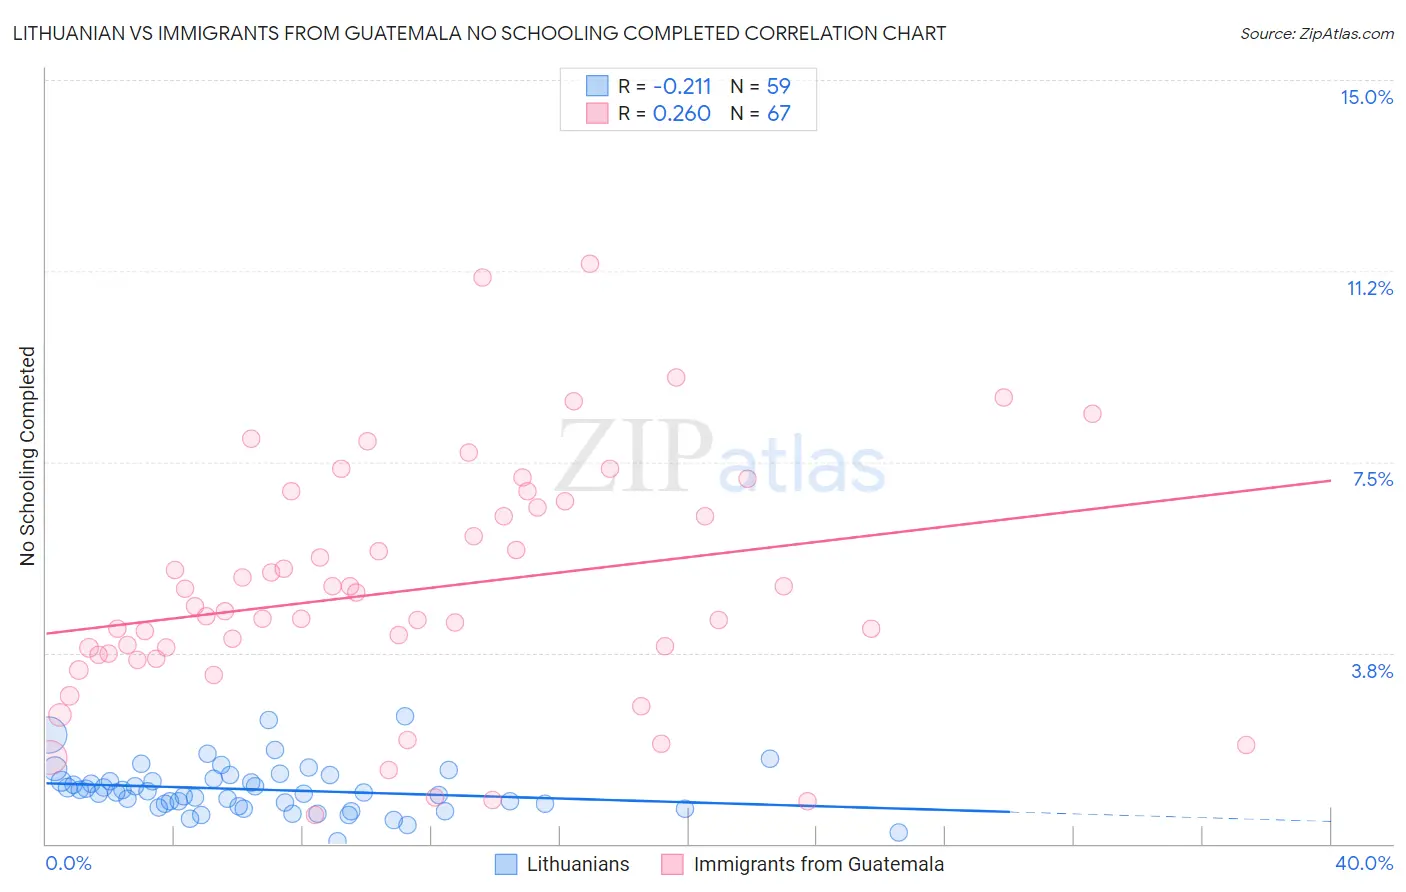
Lithuanian vs Immigrants from Guatemala No Schooling Completed Correlation Chart
The statistical analysis conducted on geographies consisting of 415,193,435 people shows a weak negative correlation between the proportion of Lithuanians and percentage of population with no schooling in the United States with a correlation coefficient (R) of -0.211 and weighted average of 1.4%. Similarly, the statistical analysis conducted on geographies consisting of 375,195,495 people shows a weak positive correlation between the proportion of Immigrants from Guatemala and percentage of population with no schooling in the United States with a correlation coefficient (R) of 0.260 and weighted average of 3.6%, a difference of 148.9%.
No Schooling Completed Correlation Summary
| Measurement | Lithuanian | Immigrants from Guatemala |
| Minimum | 0.047% | 0.58% |
| Maximum | 2.5% | 11.4% |
| Range | 2.5% | 10.8% |
| Mean | 1.1% | 5.0% |
| Median | 1.0% | 4.6% |
| Interquartile 25% (IQ1) | 0.74% | 3.7% |
| Interquartile 75% (IQ3) | 1.3% | 6.6% |
| Interquartile Range (IQR) | 0.55% | 2.9% |
| Standard Deviation (Sample) | 0.48% | 2.3% |
| Standard Deviation (Population) | 0.47% | 2.3% |
Similar Demographics by No Schooling Completed
Demographics Similar to Lithuanians by No Schooling Completed
In terms of no schooling completed, the demographic groups most similar to Lithuanians are Irish (1.4%, a difference of 0.030%), Polish (1.4%, a difference of 0.050%), Dutch (1.4%, a difference of 0.84%), Scotch-Irish (1.5%, a difference of 1.0%), and Tlingit-Haida (1.5%, a difference of 1.1%).
| Demographics | Rating | Rank | No Schooling Completed |
| Germans | 100.0 /100 | #4 | Exceptional 1.4% |
| Slovenes | 100.0 /100 | #5 | Exceptional 1.4% |
| Carpatho Rusyns | 100.0 /100 | #6 | Exceptional 1.4% |
| English | 100.0 /100 | #7 | Exceptional 1.4% |
| Swedes | 100.0 /100 | #8 | Exceptional 1.4% |
| Scottish | 100.0 /100 | #9 | Exceptional 1.4% |
| Dutch | 100.0 /100 | #10 | Exceptional 1.4% |
| Lithuanians | 100.0 /100 | #11 | Exceptional 1.4% |
| Irish | 100.0 /100 | #12 | Exceptional 1.4% |
| Poles | 100.0 /100 | #13 | Exceptional 1.4% |
| Scotch-Irish | 100.0 /100 | #14 | Exceptional 1.5% |
| Tlingit-Haida | 100.0 /100 | #15 | Exceptional 1.5% |
| Finns | 100.0 /100 | #16 | Exceptional 1.5% |
| Croatians | 100.0 /100 | #17 | Exceptional 1.5% |
| Danes | 100.0 /100 | #18 | Exceptional 1.5% |
Demographics Similar to Immigrants from Guatemala by No Schooling Completed
In terms of no schooling completed, the demographic groups most similar to Immigrants from Guatemala are Yakama (3.6%, a difference of 0.68%), Bangladeshi (3.5%, a difference of 1.0%), Immigrants from Central America (3.6%, a difference of 1.1%), Immigrants from Cabo Verde (3.5%, a difference of 1.2%), and Immigrants from Mexico (3.6%, a difference of 1.9%).
| Demographics | Rating | Rank | No Schooling Completed |
| Immigrants | Dominican Republic | 0.0 /100 | #333 | Tragic 3.4% |
| Guatemalans | 0.0 /100 | #334 | Tragic 3.5% |
| Immigrants | Cambodia | 0.0 /100 | #335 | Tragic 3.5% |
| Immigrants | Fiji | 0.0 /100 | #336 | Tragic 3.5% |
| Immigrants | Cabo Verde | 0.0 /100 | #337 | Tragic 3.5% |
| Bangladeshis | 0.0 /100 | #338 | Tragic 3.5% |
| Yakama | 0.0 /100 | #339 | Tragic 3.6% |
| Immigrants | Guatemala | 0.0 /100 | #340 | Tragic 3.6% |
| Immigrants | Central America | 0.0 /100 | #341 | Tragic 3.6% |
| Immigrants | Mexico | 0.0 /100 | #342 | Tragic 3.6% |
| Salvadorans | 0.0 /100 | #343 | Tragic 3.7% |
| Nepalese | 0.0 /100 | #344 | Tragic 3.8% |
| Immigrants | El Salvador | 0.0 /100 | #345 | Tragic 3.9% |
| Immigrants | Yemen | 0.0 /100 | #346 | Tragic 4.1% |
| Spanish American Indians | 0.0 /100 | #347 | Tragic 4.2% |