Ethiopian vs Cree No Schooling Completed
COMPARE
Ethiopian
Cree
No Schooling Completed
No Schooling Completed Comparison
Ethiopians
Cree
2.4%
NO SCHOOLING COMPLETED
0.8/ 100
METRIC RATING
255th/ 347
METRIC RANK
1.9%
NO SCHOOLING COMPLETED
94.5/ 100
METRIC RATING
122nd/ 347
METRIC RANK
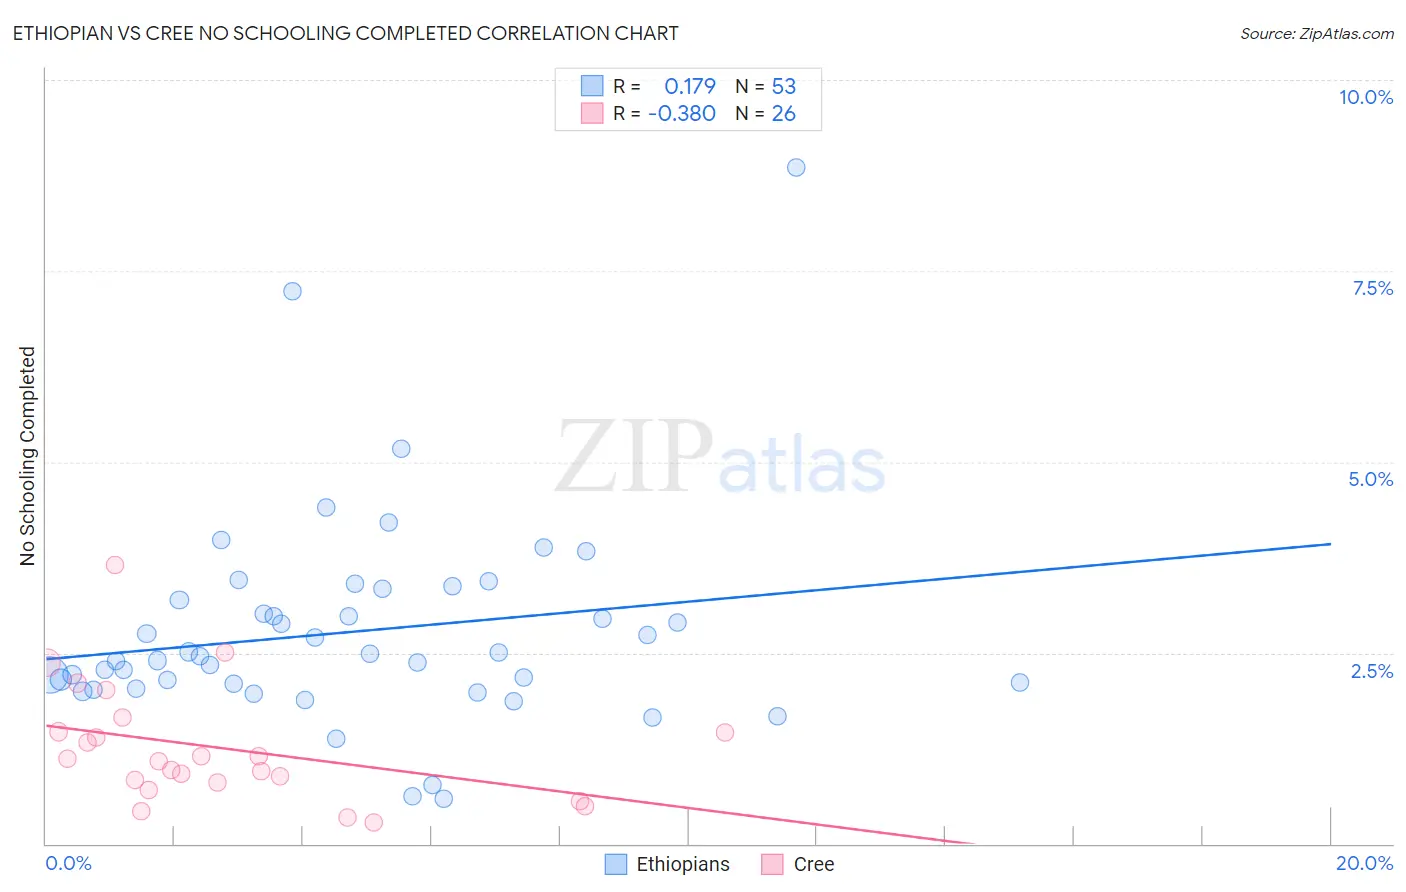
Ethiopian vs Cree No Schooling Completed Correlation Chart
The statistical analysis conducted on geographies consisting of 222,131,269 people shows a poor positive correlation between the proportion of Ethiopians and percentage of population with no schooling in the United States with a correlation coefficient (R) of 0.179 and weighted average of 2.4%. Similarly, the statistical analysis conducted on geographies consisting of 75,913,844 people shows a mild negative correlation between the proportion of Cree and percentage of population with no schooling in the United States with a correlation coefficient (R) of -0.380 and weighted average of 1.9%, a difference of 28.3%.
No Schooling Completed Correlation Summary
| Measurement | Ethiopian | Cree |
| Minimum | 0.59% | 0.28% |
| Maximum | 8.8% | 3.6% |
| Range | 8.3% | 3.4% |
| Mean | 2.8% | 1.3% |
| Median | 2.4% | 1.1% |
| Interquartile 25% (IQ1) | 2.1% | 0.80% |
| Interquartile 75% (IQ3) | 3.3% | 1.5% |
| Interquartile Range (IQR) | 1.2% | 0.67% |
| Standard Deviation (Sample) | 1.4% | 0.77% |
| Standard Deviation (Population) | 1.4% | 0.75% |
Similar Demographics by No Schooling Completed
Demographics Similar to Ethiopians by No Schooling Completed
In terms of no schooling completed, the demographic groups most similar to Ethiopians are Yaqui (2.4%, a difference of 0.17%), Immigrants from Eastern Africa (2.4%, a difference of 0.20%), Immigrants from Asia (2.4%, a difference of 0.33%), Immigrants from Colombia (2.4%, a difference of 0.45%), and Immigrants from Africa (2.4%, a difference of 0.90%).
| Demographics | Rating | Rank | No Schooling Completed |
| Asians | 1.2 /100 | #248 | Tragic 2.4% |
| Jamaicans | 1.2 /100 | #249 | Tragic 2.4% |
| Immigrants | Middle Africa | 1.1 /100 | #250 | Tragic 2.4% |
| Immigrants | Africa | 1.1 /100 | #251 | Tragic 2.4% |
| Immigrants | Colombia | 1.0 /100 | #252 | Tragic 2.4% |
| Immigrants | Asia | 0.9 /100 | #253 | Tragic 2.4% |
| Immigrants | Eastern Africa | 0.9 /100 | #254 | Tragic 2.4% |
| Ethiopians | 0.8 /100 | #255 | Tragic 2.4% |
| Yaqui | 0.8 /100 | #256 | Tragic 2.4% |
| Immigrants | South America | 0.6 /100 | #257 | Tragic 2.5% |
| Assyrians/Chaldeans/Syriacs | 0.6 /100 | #258 | Tragic 2.5% |
| Immigrants | Jamaica | 0.6 /100 | #259 | Tragic 2.5% |
| Immigrants | Ethiopia | 0.6 /100 | #260 | Tragic 2.5% |
| Armenians | 0.5 /100 | #261 | Tragic 2.5% |
| Immigrants | Sierra Leone | 0.5 /100 | #262 | Tragic 2.5% |
Demographics Similar to Cree by No Schooling Completed
In terms of no schooling completed, the demographic groups most similar to Cree are Immigrants from Croatia (1.9%, a difference of 0.030%), Immigrants from Bulgaria (1.9%, a difference of 0.090%), Immigrants from Kuwait (1.9%, a difference of 0.36%), Cambodian (1.9%, a difference of 0.44%), and Iroquois (1.9%, a difference of 0.50%).
| Demographics | Rating | Rank | No Schooling Completed |
| Syrians | 96.0 /100 | #115 | Exceptional 1.9% |
| Lebanese | 96.0 /100 | #116 | Exceptional 1.9% |
| Immigrants | Serbia | 95.8 /100 | #117 | Exceptional 1.9% |
| Spanish | 95.5 /100 | #118 | Exceptional 1.9% |
| Iroquois | 95.1 /100 | #119 | Exceptional 1.9% |
| Immigrants | Bulgaria | 94.6 /100 | #120 | Exceptional 1.9% |
| Immigrants | Croatia | 94.5 /100 | #121 | Exceptional 1.9% |
| Cree | 94.5 /100 | #122 | Exceptional 1.9% |
| Immigrants | Kuwait | 93.9 /100 | #123 | Exceptional 1.9% |
| Cambodians | 93.8 /100 | #124 | Exceptional 1.9% |
| Immigrants | Europe | 93.7 /100 | #125 | Exceptional 1.9% |
| Immigrants | Romania | 92.6 /100 | #126 | Exceptional 1.9% |
| Israelis | 92.4 /100 | #127 | Exceptional 1.9% |
| Spaniards | 92.3 /100 | #128 | Exceptional 1.9% |
| Seminole | 92.0 /100 | #129 | Exceptional 1.9% |