Lithuanian vs Immigrants from Syria No Schooling Completed
COMPARE
Lithuanian
Immigrants from Syria
No Schooling Completed
No Schooling Completed Comparison
Lithuanians
Immigrants from Syria
1.4%
NO SCHOOLING COMPLETED
100.0/ 100
METRIC RATING
11th/ 347
METRIC RANK
2.3%
NO SCHOOLING COMPLETED
6.6/ 100
METRIC RATING
217th/ 347
METRIC RANK
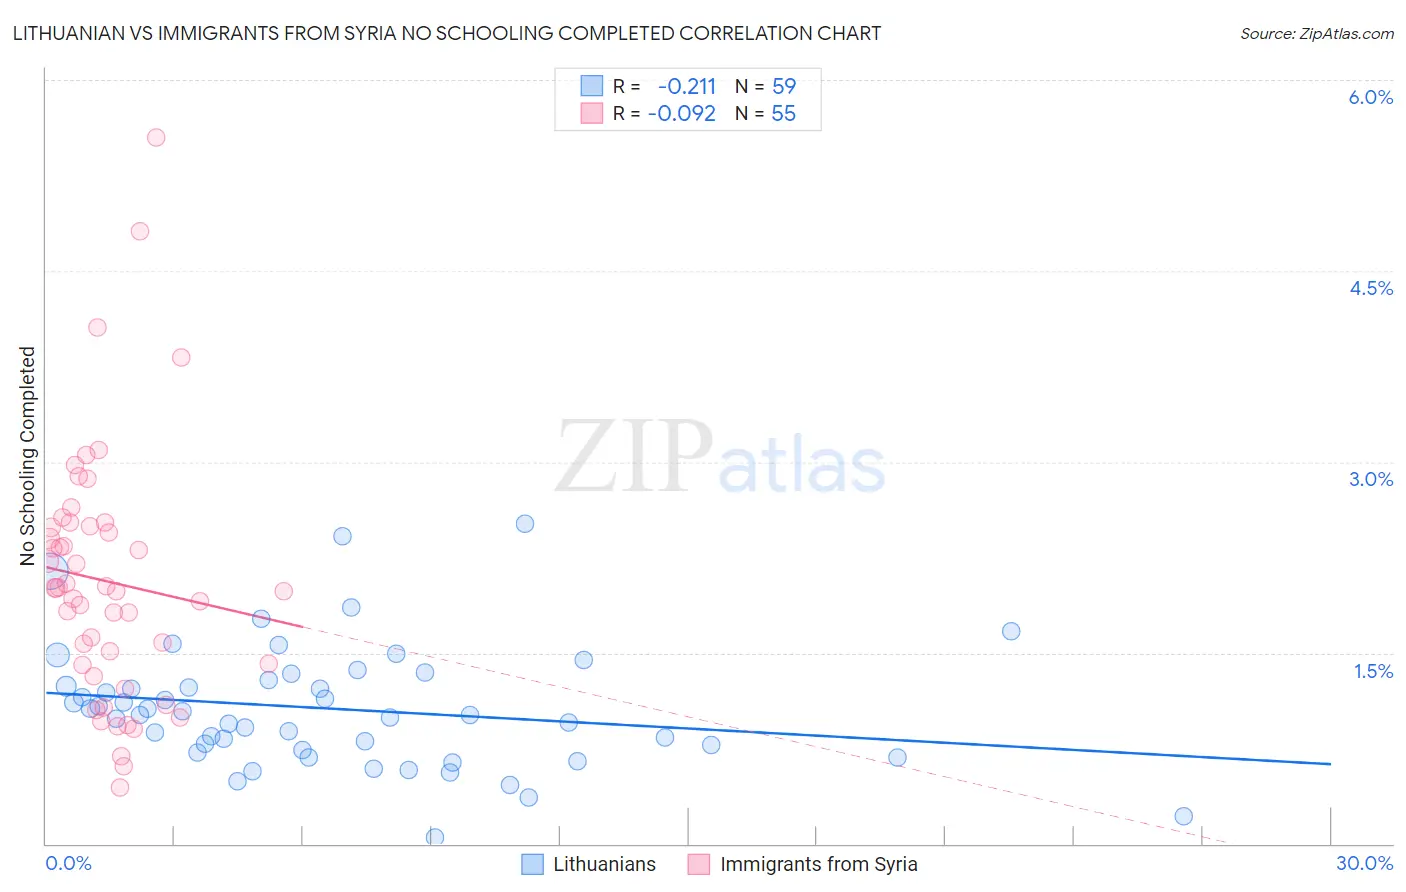
Lithuanian vs Immigrants from Syria No Schooling Completed Correlation Chart
The statistical analysis conducted on geographies consisting of 415,193,435 people shows a weak negative correlation between the proportion of Lithuanians and percentage of population with no schooling in the United States with a correlation coefficient (R) of -0.211 and weighted average of 1.4%. Similarly, the statistical analysis conducted on geographies consisting of 173,620,316 people shows a slight negative correlation between the proportion of Immigrants from Syria and percentage of population with no schooling in the United States with a correlation coefficient (R) of -0.092 and weighted average of 2.3%, a difference of 58.5%.
No Schooling Completed Correlation Summary
| Measurement | Lithuanian | Immigrants from Syria |
| Minimum | 0.047% | 0.44% |
| Maximum | 2.5% | 5.6% |
| Range | 2.5% | 5.1% |
| Mean | 1.1% | 2.1% |
| Median | 1.0% | 2.0% |
| Interquartile 25% (IQ1) | 0.74% | 1.4% |
| Interquartile 75% (IQ3) | 1.3% | 2.5% |
| Interquartile Range (IQR) | 0.55% | 1.1% |
| Standard Deviation (Sample) | 0.48% | 0.98% |
| Standard Deviation (Population) | 0.47% | 0.97% |
Similar Demographics by No Schooling Completed
Demographics Similar to Lithuanians by No Schooling Completed
In terms of no schooling completed, the demographic groups most similar to Lithuanians are Irish (1.4%, a difference of 0.030%), Polish (1.4%, a difference of 0.050%), Dutch (1.4%, a difference of 0.84%), Scotch-Irish (1.5%, a difference of 1.0%), and Tlingit-Haida (1.5%, a difference of 1.1%).
| Demographics | Rating | Rank | No Schooling Completed |
| Germans | 100.0 /100 | #4 | Exceptional 1.4% |
| Slovenes | 100.0 /100 | #5 | Exceptional 1.4% |
| Carpatho Rusyns | 100.0 /100 | #6 | Exceptional 1.4% |
| English | 100.0 /100 | #7 | Exceptional 1.4% |
| Swedes | 100.0 /100 | #8 | Exceptional 1.4% |
| Scottish | 100.0 /100 | #9 | Exceptional 1.4% |
| Dutch | 100.0 /100 | #10 | Exceptional 1.4% |
| Lithuanians | 100.0 /100 | #11 | Exceptional 1.4% |
| Irish | 100.0 /100 | #12 | Exceptional 1.4% |
| Poles | 100.0 /100 | #13 | Exceptional 1.4% |
| Scotch-Irish | 100.0 /100 | #14 | Exceptional 1.5% |
| Tlingit-Haida | 100.0 /100 | #15 | Exceptional 1.5% |
| Finns | 100.0 /100 | #16 | Exceptional 1.5% |
| Croatians | 100.0 /100 | #17 | Exceptional 1.5% |
| Danes | 100.0 /100 | #18 | Exceptional 1.5% |
Demographics Similar to Immigrants from Syria by No Schooling Completed
In terms of no schooling completed, the demographic groups most similar to Immigrants from Syria are Tongan (2.3%, a difference of 0.090%), Immigrants from Nepal (2.3%, a difference of 0.11%), Immigrants from Zaire (2.3%, a difference of 0.28%), Senegalese (2.3%, a difference of 0.55%), and Samoan (2.3%, a difference of 0.72%).
| Demographics | Rating | Rank | No Schooling Completed |
| Natives/Alaskans | 10.0 /100 | #210 | Tragic 2.2% |
| Immigrants | Panama | 8.8 /100 | #211 | Tragic 2.3% |
| Immigrants | Morocco | 8.7 /100 | #212 | Tragic 2.3% |
| Ute | 8.2 /100 | #213 | Tragic 2.3% |
| Samoans | 8.2 /100 | #214 | Tragic 2.3% |
| Immigrants | Zaire | 7.2 /100 | #215 | Tragic 2.3% |
| Tongans | 6.8 /100 | #216 | Tragic 2.3% |
| Immigrants | Syria | 6.6 /100 | #217 | Tragic 2.3% |
| Immigrants | Nepal | 6.4 /100 | #218 | Tragic 2.3% |
| Senegalese | 5.6 /100 | #219 | Tragic 2.3% |
| Immigrants | Costa Rica | 5.1 /100 | #220 | Tragic 2.3% |
| Immigrants | Sudan | 5.0 /100 | #221 | Tragic 2.3% |
| Sub-Saharan Africans | 4.7 /100 | #222 | Tragic 2.3% |
| Immigrants | Lebanon | 4.5 /100 | #223 | Tragic 2.3% |
| Tohono O'odham | 4.1 /100 | #224 | Tragic 2.3% |