Immigrants from Somalia vs Crow 2 or more Vehicles in Household
COMPARE
Immigrants from Somalia
Crow
2 or more Vehicles in Household
2 or more Vehicles in Household Comparison
Immigrants from Somalia
Crow
50.5%
2 OR MORE VEHICLES IN HOUSEHOLD
0.0/ 100
METRIC RATING
296th/ 347
METRIC RANK
55.7%
2 OR MORE VEHICLES IN HOUSEHOLD
67.0/ 100
METRIC RATING
160th/ 347
METRIC RANK
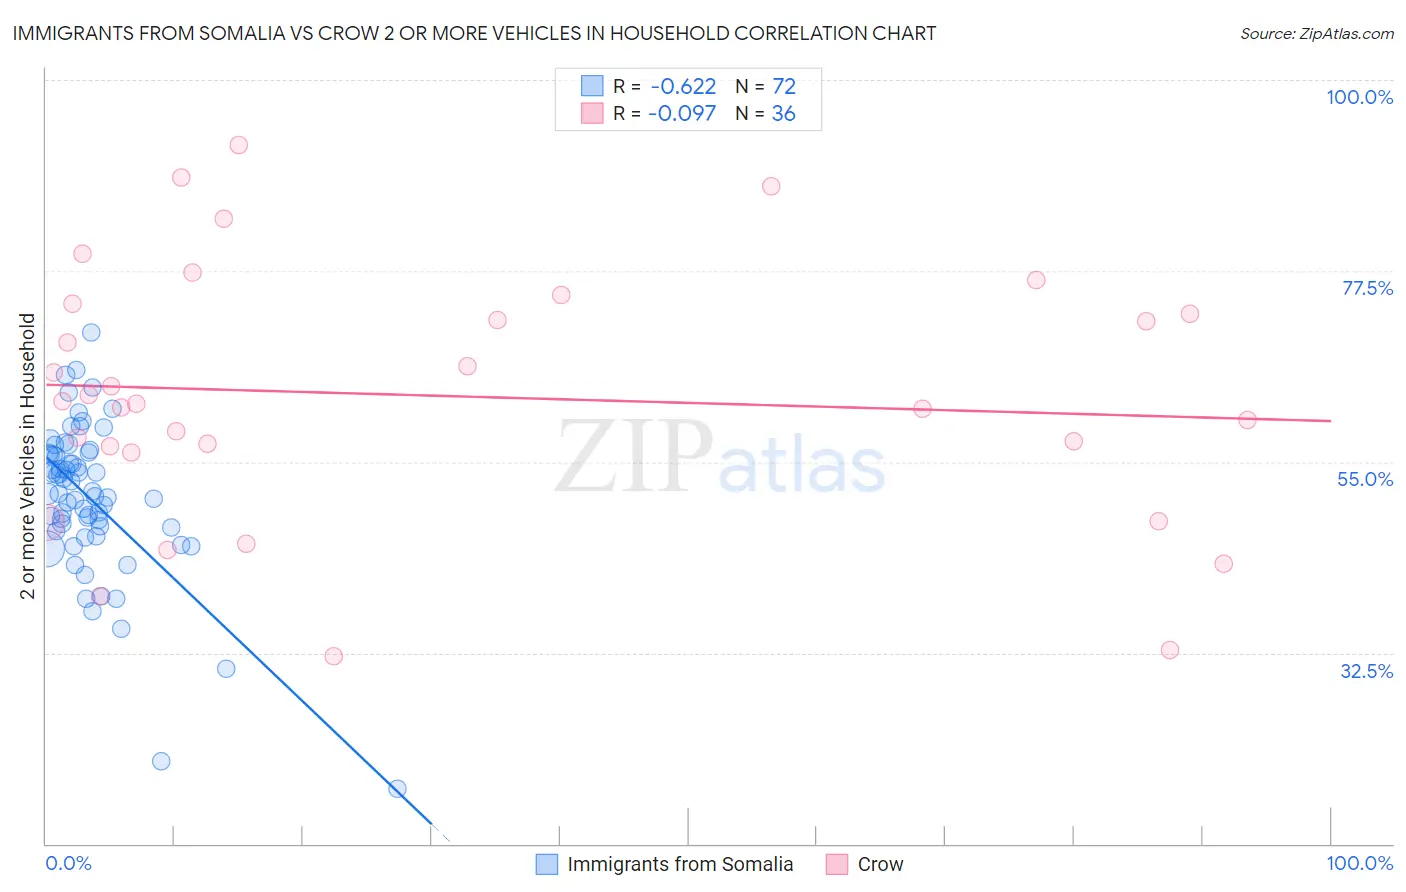
Immigrants from Somalia vs Crow 2 or more Vehicles in Household Correlation Chart
The statistical analysis conducted on geographies consisting of 92,099,501 people shows a significant negative correlation between the proportion of Immigrants from Somalia and percentage of households with 2 or more vehicles available in the United States with a correlation coefficient (R) of -0.622 and weighted average of 50.5%. Similarly, the statistical analysis conducted on geographies consisting of 59,203,156 people shows a slight negative correlation between the proportion of Crow and percentage of households with 2 or more vehicles available in the United States with a correlation coefficient (R) of -0.097 and weighted average of 55.7%, a difference of 10.3%.
2 or more Vehicles in Household Correlation Summary
| Measurement | Immigrants from Somalia | Crow |
| Minimum | 16.4% | 32.0% |
| Maximum | 70.3% | 92.3% |
| Range | 53.8% | 60.3% |
| Mean | 50.6% | 62.8% |
| Median | 51.2% | 62.0% |
| Interquartile 25% (IQ1) | 47.1% | 56.5% |
| Interquartile 75% (IQ3) | 55.9% | 73.1% |
| Interquartile Range (IQR) | 8.8% | 16.6% |
| Standard Deviation (Sample) | 9.2% | 15.0% |
| Standard Deviation (Population) | 9.1% | 14.8% |
Similar Demographics by 2 or more Vehicles in Household
Demographics Similar to Immigrants from Somalia by 2 or more Vehicles in Household
In terms of 2 or more vehicles in household, the demographic groups most similar to Immigrants from Somalia are Cypriot (50.6%, a difference of 0.040%), Bermudan (50.6%, a difference of 0.11%), Immigrants from Spain (50.4%, a difference of 0.27%), Paraguayan (50.3%, a difference of 0.40%), and Immigrants from Morocco (50.3%, a difference of 0.43%).
| Demographics | Rating | Rank | 2 or more Vehicles in Household |
| Somalis | 0.0 /100 | #289 | Tragic 51.1% |
| Immigrants | Panama | 0.0 /100 | #290 | Tragic 51.1% |
| Belizeans | 0.0 /100 | #291 | Tragic 51.0% |
| Immigrants | Ukraine | 0.0 /100 | #292 | Tragic 50.9% |
| Blacks/African Americans | 0.0 /100 | #293 | Tragic 50.9% |
| Bermudans | 0.0 /100 | #294 | Tragic 50.6% |
| Cypriots | 0.0 /100 | #295 | Tragic 50.6% |
| Immigrants | Somalia | 0.0 /100 | #296 | Tragic 50.5% |
| Immigrants | Spain | 0.0 /100 | #297 | Tragic 50.4% |
| Paraguayans | 0.0 /100 | #298 | Tragic 50.3% |
| Immigrants | Morocco | 0.0 /100 | #299 | Tragic 50.3% |
| Immigrants | Russia | 0.0 /100 | #300 | Tragic 50.3% |
| Immigrants | Greece | 0.0 /100 | #301 | Tragic 50.2% |
| Immigrants | South America | 0.0 /100 | #302 | Tragic 50.2% |
| Tohono O'odham | 0.0 /100 | #303 | Tragic 50.0% |
Demographics Similar to Crow by 2 or more Vehicles in Household
In terms of 2 or more vehicles in household, the demographic groups most similar to Crow are Paiute (55.8%, a difference of 0.050%), Tlingit-Haida (55.8%, a difference of 0.070%), Immigrants from Kuwait (55.8%, a difference of 0.14%), Immigrants from Lithuania (55.8%, a difference of 0.15%), and Ukrainian (55.8%, a difference of 0.17%).
| Demographics | Rating | Rank | 2 or more Vehicles in Household |
| Lumbee | 71.9 /100 | #153 | Good 55.9% |
| Ukrainians | 70.8 /100 | #154 | Good 55.8% |
| Immigrants | Venezuela | 70.7 /100 | #155 | Good 55.8% |
| Immigrants | Lithuania | 70.4 /100 | #156 | Good 55.8% |
| Immigrants | Kuwait | 70.2 /100 | #157 | Good 55.8% |
| Tlingit-Haida | 68.5 /100 | #158 | Good 55.8% |
| Paiute | 68.0 /100 | #159 | Good 55.8% |
| Crow | 67.0 /100 | #160 | Good 55.7% |
| Colville | 61.1 /100 | #161 | Good 55.6% |
| German Russians | 60.9 /100 | #162 | Good 55.6% |
| Immigrants | Zimbabwe | 60.2 /100 | #163 | Good 55.6% |
| Dutch West Indians | 59.8 /100 | #164 | Average 55.6% |
| Immigrants | El Salvador | 59.4 /100 | #165 | Average 55.6% |
| Immigrants | Sri Lanka | 58.3 /100 | #166 | Average 55.5% |
| Kenyans | 58.1 /100 | #167 | Average 55.5% |