Immigrants from Somalia vs Basque College, 1 year or more
COMPARE
Immigrants from Somalia
Basque
College, 1 year or more
College, 1 year or more Comparison
Immigrants from Somalia
Basques
59.7%
COLLEGE, 1 YEAR OR MORE
58.3/ 100
METRIC RATING
163rd/ 347
METRIC RANK
60.9%
COLLEGE, 1 YEAR OR MORE
87.2/ 100
METRIC RATING
136th/ 347
METRIC RANK
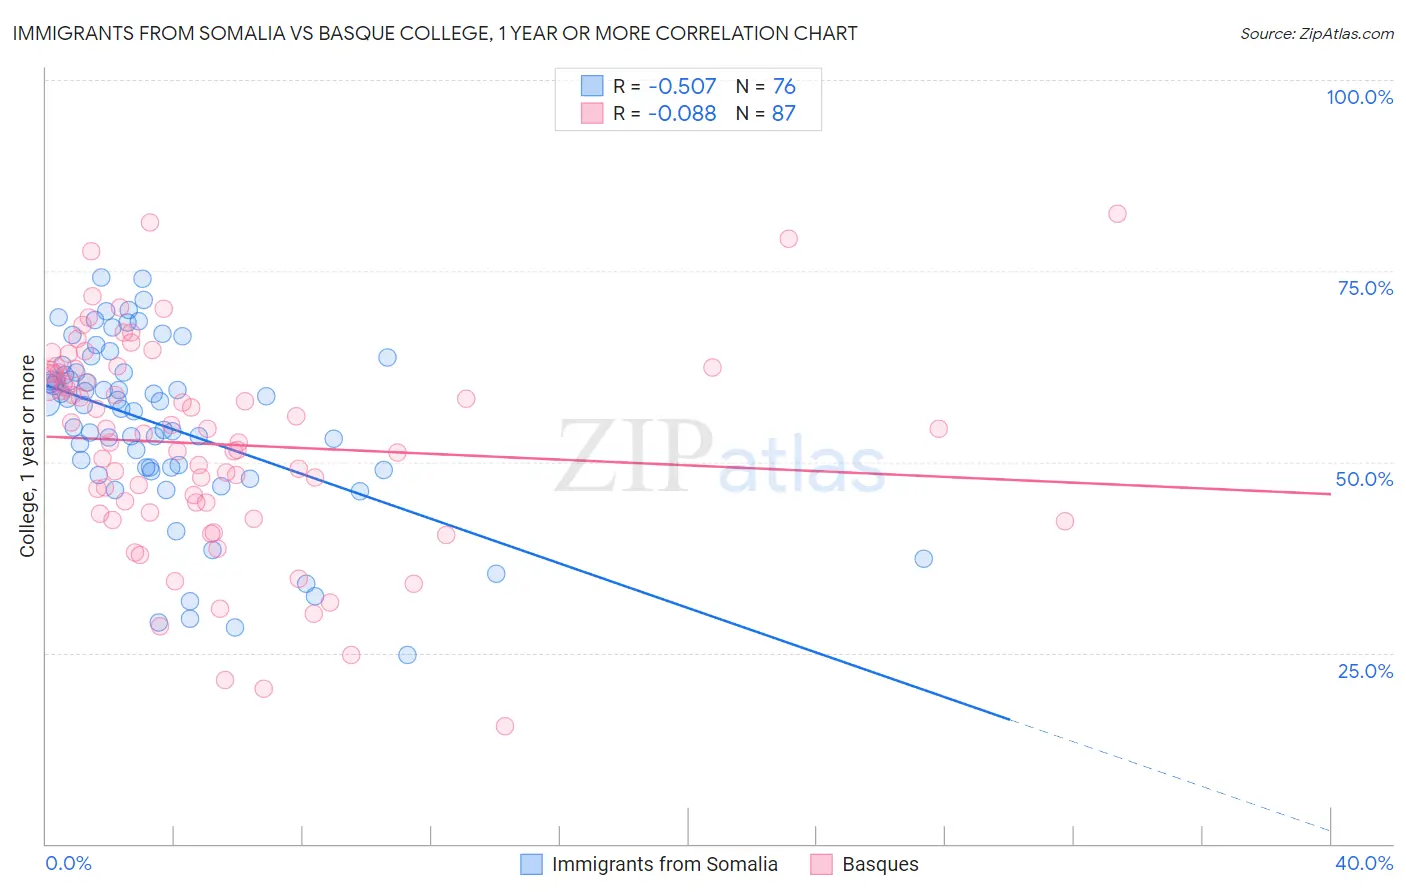
Immigrants from Somalia vs Basque College, 1 year or more Correlation Chart
The statistical analysis conducted on geographies consisting of 92,111,755 people shows a substantial negative correlation between the proportion of Immigrants from Somalia and percentage of population with at least college, 1 year or more education in the United States with a correlation coefficient (R) of -0.507 and weighted average of 59.7%. Similarly, the statistical analysis conducted on geographies consisting of 165,778,610 people shows a slight negative correlation between the proportion of Basques and percentage of population with at least college, 1 year or more education in the United States with a correlation coefficient (R) of -0.088 and weighted average of 60.9%, a difference of 2.1%.
College, 1 year or more Correlation Summary
| Measurement | Immigrants from Somalia | Basque |
| Minimum | 24.7% | 15.4% |
| Maximum | 74.1% | 82.5% |
| Range | 49.4% | 67.1% |
| Mean | 54.7% | 52.3% |
| Median | 57.6% | 53.6% |
| Interquartile 25% (IQ1) | 49.0% | 43.4% |
| Interquartile 75% (IQ3) | 61.7% | 61.8% |
| Interquartile Range (IQR) | 12.7% | 18.4% |
| Standard Deviation (Sample) | 11.5% | 13.7% |
| Standard Deviation (Population) | 11.4% | 13.7% |
Similar Demographics by College, 1 year or more
Demographics Similar to Immigrants from Somalia by College, 1 year or more
In terms of college, 1 year or more, the demographic groups most similar to Immigrants from Somalia are Korean (59.7%, a difference of 0.010%), Belgian (59.7%, a difference of 0.010%), Irish (59.6%, a difference of 0.12%), Immigrants from Africa (59.6%, a difference of 0.12%), and Immigrants from North Macedonia (59.5%, a difference of 0.28%).
| Demographics | Rating | Rank | College, 1 year or more |
| Finns | 72.9 /100 | #156 | Good 60.2% |
| Immigrants | Armenia | 68.8 /100 | #157 | Good 60.0% |
| English | 67.2 /100 | #158 | Good 60.0% |
| Immigrants | Iraq | 67.0 /100 | #159 | Good 60.0% |
| South American Indians | 66.9 /100 | #160 | Good 60.0% |
| Somalis | 64.5 /100 | #161 | Good 59.9% |
| Koreans | 58.5 /100 | #162 | Average 59.7% |
| Immigrants | Somalia | 58.3 /100 | #163 | Average 59.7% |
| Belgians | 58.1 /100 | #164 | Average 59.7% |
| Irish | 56.1 /100 | #165 | Average 59.6% |
| Immigrants | Africa | 56.1 /100 | #166 | Average 59.6% |
| Immigrants | North Macedonia | 53.1 /100 | #167 | Average 59.5% |
| Hungarians | 52.9 /100 | #168 | Average 59.5% |
| Immigrants | Southern Europe | 52.7 /100 | #169 | Average 59.5% |
| Welsh | 52.4 /100 | #170 | Average 59.5% |
Demographics Similar to Basques by College, 1 year or more
In terms of college, 1 year or more, the demographic groups most similar to Basques are Immigrants from Uganda (60.9%, a difference of 0.020%), Immigrants from Venezuela (61.0%, a difference of 0.080%), Immigrants from Uzbekistan (61.0%, a difference of 0.090%), Slovene (60.9%, a difference of 0.090%), and Scandinavian (61.0%, a difference of 0.12%).
| Demographics | Rating | Rank | College, 1 year or more |
| Ugandans | 90.7 /100 | #129 | Exceptional 61.2% |
| Italians | 89.5 /100 | #130 | Excellent 61.1% |
| Immigrants | Morocco | 89.5 /100 | #131 | Excellent 61.1% |
| Scandinavians | 88.2 /100 | #132 | Excellent 61.0% |
| Immigrants | Uzbekistan | 88.0 /100 | #133 | Excellent 61.0% |
| Immigrants | Venezuela | 87.9 /100 | #134 | Excellent 61.0% |
| Immigrants | Uganda | 87.4 /100 | #135 | Excellent 60.9% |
| Basques | 87.2 /100 | #136 | Excellent 60.9% |
| Slovenes | 86.5 /100 | #137 | Excellent 60.9% |
| Taiwanese | 84.3 /100 | #138 | Excellent 60.7% |
| Immigrants | Eritrea | 84.3 /100 | #139 | Excellent 60.7% |
| Iraqis | 83.3 /100 | #140 | Excellent 60.7% |
| Immigrants | Afghanistan | 83.1 /100 | #141 | Excellent 60.7% |
| Poles | 82.8 /100 | #142 | Excellent 60.7% |
| Canadians | 82.7 /100 | #143 | Excellent 60.6% |