Immigrants from Pakistan vs Immigrants from Sudan GED/Equivalency
COMPARE
Immigrants from Pakistan
Immigrants from Sudan
GED/Equivalency
GED/Equivalency Comparison
Immigrants from Pakistan
Immigrants from Sudan
86.4%
GED/EQUIVALENCY
82.4/ 100
METRIC RATING
143rd/ 347
METRIC RANK
85.5%
GED/EQUIVALENCY
34.2/ 100
METRIC RATING
183rd/ 347
METRIC RANK
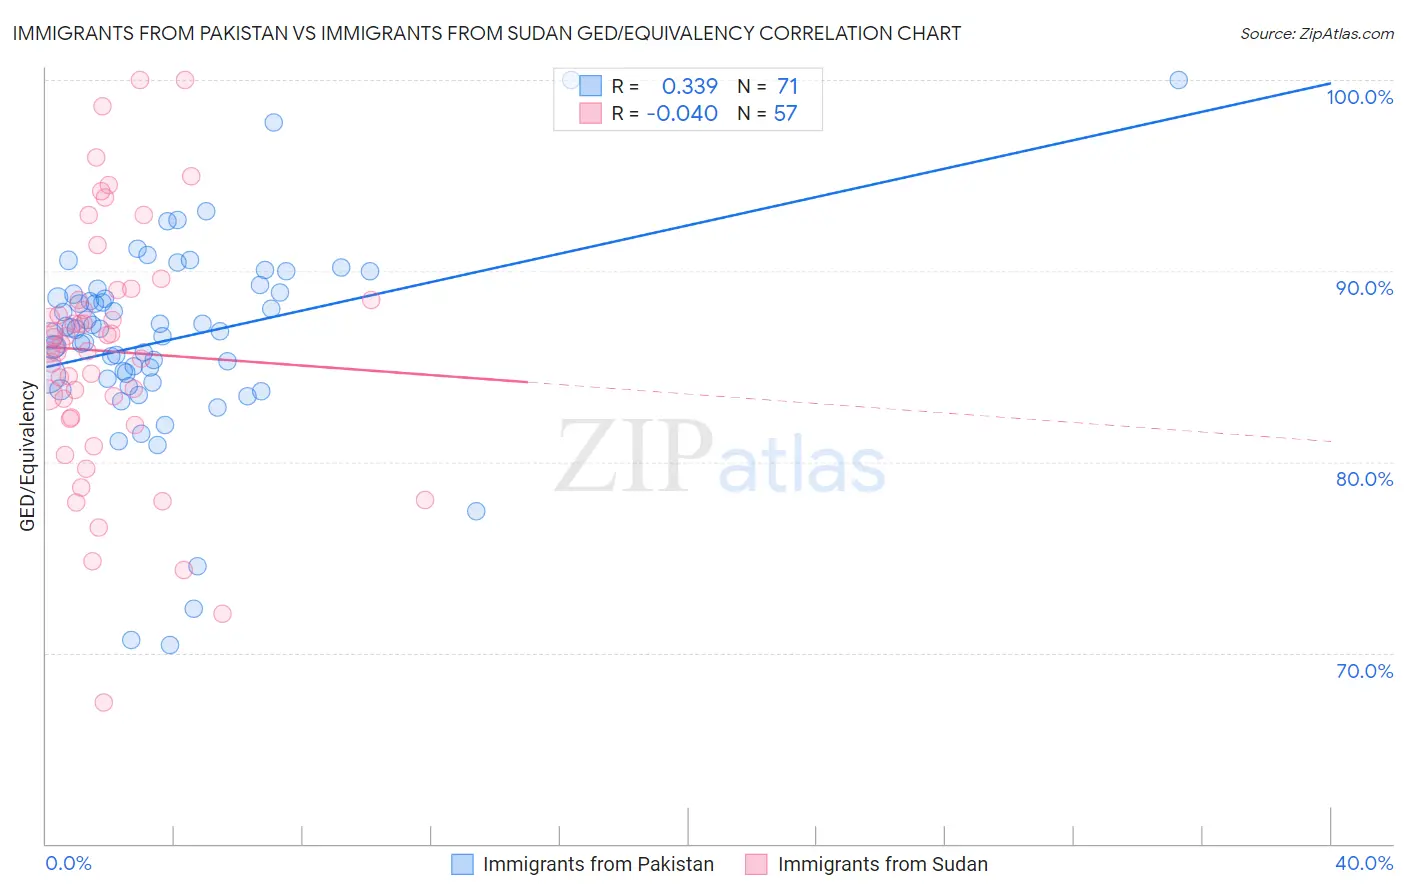
Immigrants from Pakistan vs Immigrants from Sudan GED/Equivalency Correlation Chart
The statistical analysis conducted on geographies consisting of 283,912,995 people shows a mild positive correlation between the proportion of Immigrants from Pakistan and percentage of population with at least ged/equivalency education in the United States with a correlation coefficient (R) of 0.339 and weighted average of 86.4%. Similarly, the statistical analysis conducted on geographies consisting of 118,959,807 people shows no correlation between the proportion of Immigrants from Sudan and percentage of population with at least ged/equivalency education in the United States with a correlation coefficient (R) of -0.040 and weighted average of 85.5%, a difference of 1.1%.
GED/Equivalency Correlation Summary
| Measurement | Immigrants from Pakistan | Immigrants from Sudan |
| Minimum | 70.4% | 67.4% |
| Maximum | 100.0% | 100.0% |
| Range | 29.6% | 32.6% |
| Mean | 86.4% | 85.8% |
| Median | 87.0% | 86.2% |
| Interquartile 25% (IQ1) | 84.4% | 82.3% |
| Interquartile 75% (IQ3) | 88.9% | 88.7% |
| Interquartile Range (IQR) | 4.5% | 6.4% |
| Standard Deviation (Sample) | 5.3% | 6.6% |
| Standard Deviation (Population) | 5.2% | 6.5% |
Similar Demographics by GED/Equivalency
Demographics Similar to Immigrants from Pakistan by GED/Equivalency
In terms of ged/equivalency, the demographic groups most similar to Immigrants from Pakistan are Immigrants from Indonesia (86.4%, a difference of 0.0%), Bolivian (86.4%, a difference of 0.010%), Laotian (86.5%, a difference of 0.030%), Paraguayan (86.5%, a difference of 0.060%), and Pakistani (86.4%, a difference of 0.070%).
| Demographics | Rating | Rank | GED/Equivalency |
| Chileans | 86.9 /100 | #136 | Excellent 86.6% |
| Arabs | 86.7 /100 | #137 | Excellent 86.6% |
| Immigrants | Argentina | 86.5 /100 | #138 | Excellent 86.6% |
| Immigrants | Malaysia | 85.0 /100 | #139 | Excellent 86.5% |
| Paraguayans | 84.1 /100 | #140 | Excellent 86.5% |
| Laotians | 83.2 /100 | #141 | Excellent 86.5% |
| Immigrants | Indonesia | 82.4 /100 | #142 | Excellent 86.4% |
| Immigrants | Pakistan | 82.4 /100 | #143 | Excellent 86.4% |
| Bolivians | 82.1 /100 | #144 | Excellent 86.4% |
| Pakistanis | 80.4 /100 | #145 | Excellent 86.4% |
| Basques | 79.5 /100 | #146 | Good 86.4% |
| Immigrants | Northern Africa | 79.3 /100 | #147 | Good 86.3% |
| Immigrants | Poland | 79.3 /100 | #148 | Good 86.3% |
| Menominee | 79.3 /100 | #149 | Good 86.3% |
| Immigrants | Western Asia | 78.8 /100 | #150 | Good 86.3% |
Demographics Similar to Immigrants from Sudan by GED/Equivalency
In terms of ged/equivalency, the demographic groups most similar to Immigrants from Sudan are Immigrants from Oceania (85.5%, a difference of 0.010%), Sudanese (85.5%, a difference of 0.020%), Spanish (85.4%, a difference of 0.030%), Spaniard (85.4%, a difference of 0.050%), and Moroccan (85.5%, a difference of 0.080%).
| Demographics | Rating | Rank | GED/Equivalency |
| Immigrants | Eastern Africa | 47.7 /100 | #176 | Average 85.7% |
| Immigrants | Uganda | 45.2 /100 | #177 | Average 85.7% |
| Koreans | 41.2 /100 | #178 | Average 85.6% |
| Aleuts | 40.5 /100 | #179 | Average 85.6% |
| Immigrants | Southern Europe | 38.4 /100 | #180 | Fair 85.5% |
| Moroccans | 37.7 /100 | #181 | Fair 85.5% |
| Sudanese | 35.2 /100 | #182 | Fair 85.5% |
| Immigrants | Sudan | 34.2 /100 | #183 | Fair 85.5% |
| Immigrants | Oceania | 33.6 /100 | #184 | Fair 85.5% |
| Spanish | 32.8 /100 | #185 | Fair 85.4% |
| Spaniards | 31.9 /100 | #186 | Fair 85.4% |
| Immigrants | Afghanistan | 29.8 /100 | #187 | Fair 85.4% |
| Immigrants | Sierra Leone | 29.0 /100 | #188 | Fair 85.4% |
| Guamanians/Chamorros | 28.4 /100 | #189 | Fair 85.3% |
| Alaskan Athabascans | 27.5 /100 | #190 | Fair 85.3% |