Immigrants from Portugal vs Immigrants from Sudan GED/Equivalency
COMPARE
Immigrants from Portugal
Immigrants from Sudan
GED/Equivalency
GED/Equivalency Comparison
Immigrants from Portugal
Immigrants from Sudan
81.6%
GED/EQUIVALENCY
0.0/ 100
METRIC RATING
303rd/ 347
METRIC RANK
85.5%
GED/EQUIVALENCY
34.2/ 100
METRIC RATING
183rd/ 347
METRIC RANK
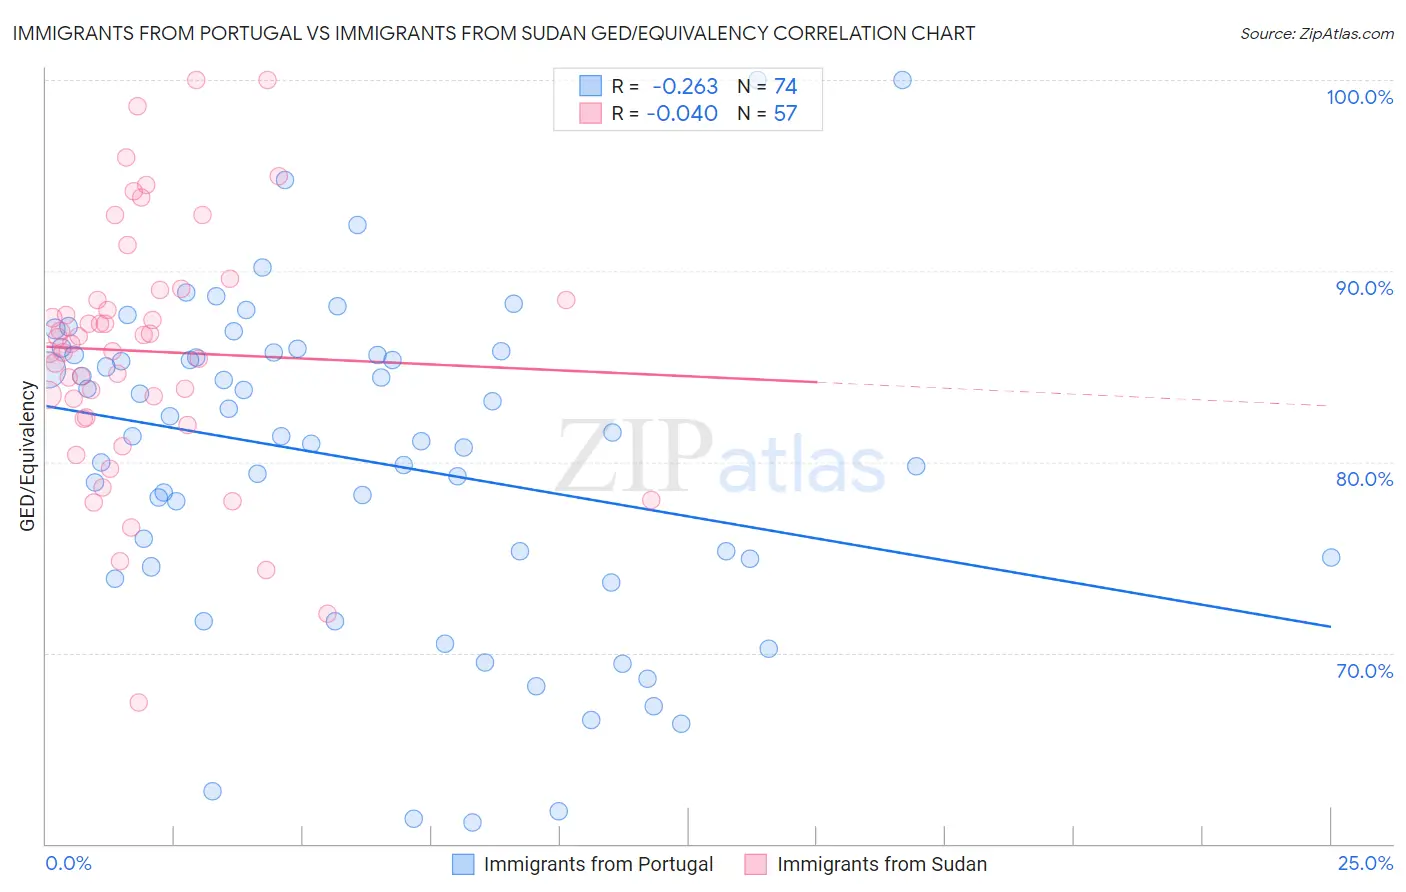
Immigrants from Portugal vs Immigrants from Sudan GED/Equivalency Correlation Chart
The statistical analysis conducted on geographies consisting of 174,792,669 people shows a weak negative correlation between the proportion of Immigrants from Portugal and percentage of population with at least ged/equivalency education in the United States with a correlation coefficient (R) of -0.263 and weighted average of 81.6%. Similarly, the statistical analysis conducted on geographies consisting of 118,959,807 people shows no correlation between the proportion of Immigrants from Sudan and percentage of population with at least ged/equivalency education in the United States with a correlation coefficient (R) of -0.040 and weighted average of 85.5%, a difference of 4.8%.
GED/Equivalency Correlation Summary
| Measurement | Immigrants from Portugal | Immigrants from Sudan |
| Minimum | 61.1% | 67.4% |
| Maximum | 100.0% | 100.0% |
| Range | 38.9% | 32.6% |
| Mean | 80.1% | 85.8% |
| Median | 81.3% | 86.2% |
| Interquartile 25% (IQ1) | 74.9% | 82.3% |
| Interquartile 75% (IQ3) | 85.6% | 88.7% |
| Interquartile Range (IQR) | 10.7% | 6.4% |
| Standard Deviation (Sample) | 8.5% | 6.6% |
| Standard Deviation (Population) | 8.4% | 6.5% |
Similar Demographics by GED/Equivalency
Demographics Similar to Immigrants from Portugal by GED/Equivalency
In terms of ged/equivalency, the demographic groups most similar to Immigrants from Portugal are Immigrants from Haiti (81.6%, a difference of 0.0%), Dutch West Indian (81.6%, a difference of 0.040%), Fijian (81.6%, a difference of 0.10%), Navajo (81.5%, a difference of 0.10%), and Ecuadorian (81.7%, a difference of 0.17%).
| Demographics | Rating | Rank | GED/Equivalency |
| Vietnamese | 0.0 /100 | #296 | Tragic 81.9% |
| Immigrants | Bangladesh | 0.0 /100 | #297 | Tragic 81.9% |
| Ute | 0.0 /100 | #298 | Tragic 81.8% |
| Ecuadorians | 0.0 /100 | #299 | Tragic 81.7% |
| Fijians | 0.0 /100 | #300 | Tragic 81.6% |
| Dutch West Indians | 0.0 /100 | #301 | Tragic 81.6% |
| Immigrants | Haiti | 0.0 /100 | #302 | Tragic 81.6% |
| Immigrants | Portugal | 0.0 /100 | #303 | Tragic 81.6% |
| Navajo | 0.0 /100 | #304 | Tragic 81.5% |
| Immigrants | Grenada | 0.0 /100 | #305 | Tragic 81.3% |
| Guyanese | 0.0 /100 | #306 | Tragic 81.3% |
| Immigrants | Dominica | 0.0 /100 | #307 | Tragic 81.1% |
| Puerto Ricans | 0.0 /100 | #308 | Tragic 81.1% |
| Immigrants | Ecuador | 0.0 /100 | #309 | Tragic 81.0% |
| Immigrants | Guyana | 0.0 /100 | #310 | Tragic 81.0% |
Demographics Similar to Immigrants from Sudan by GED/Equivalency
In terms of ged/equivalency, the demographic groups most similar to Immigrants from Sudan are Immigrants from Oceania (85.5%, a difference of 0.010%), Sudanese (85.5%, a difference of 0.020%), Spanish (85.4%, a difference of 0.030%), Spaniard (85.4%, a difference of 0.050%), and Moroccan (85.5%, a difference of 0.080%).
| Demographics | Rating | Rank | GED/Equivalency |
| Immigrants | Eastern Africa | 47.7 /100 | #176 | Average 85.7% |
| Immigrants | Uganda | 45.2 /100 | #177 | Average 85.7% |
| Koreans | 41.2 /100 | #178 | Average 85.6% |
| Aleuts | 40.5 /100 | #179 | Average 85.6% |
| Immigrants | Southern Europe | 38.4 /100 | #180 | Fair 85.5% |
| Moroccans | 37.7 /100 | #181 | Fair 85.5% |
| Sudanese | 35.2 /100 | #182 | Fair 85.5% |
| Immigrants | Sudan | 34.2 /100 | #183 | Fair 85.5% |
| Immigrants | Oceania | 33.6 /100 | #184 | Fair 85.5% |
| Spanish | 32.8 /100 | #185 | Fair 85.4% |
| Spaniards | 31.9 /100 | #186 | Fair 85.4% |
| Immigrants | Afghanistan | 29.8 /100 | #187 | Fair 85.4% |
| Immigrants | Sierra Leone | 29.0 /100 | #188 | Fair 85.4% |
| Guamanians/Chamorros | 28.4 /100 | #189 | Fair 85.3% |
| Alaskan Athabascans | 27.5 /100 | #190 | Fair 85.3% |