Immigrants from Southern Europe vs Immigrants from Sudan GED/Equivalency
COMPARE
Immigrants from Southern Europe
Immigrants from Sudan
GED/Equivalency
GED/Equivalency Comparison
Immigrants from Southern Europe
Immigrants from Sudan
85.5%
GED/EQUIVALENCY
38.4/ 100
METRIC RATING
180th/ 347
METRIC RANK
85.5%
GED/EQUIVALENCY
34.2/ 100
METRIC RATING
183rd/ 347
METRIC RANK
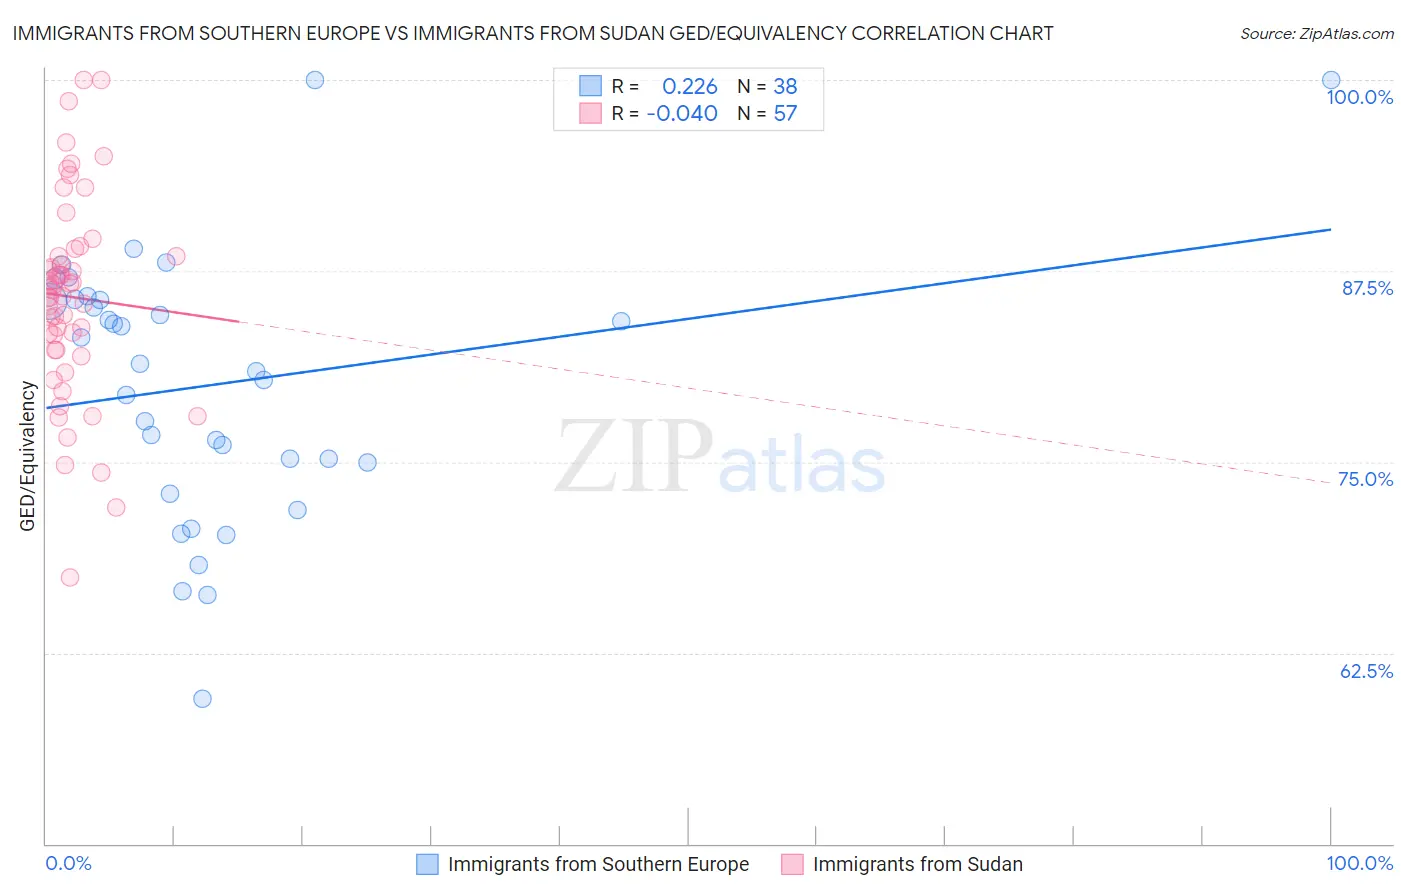
Immigrants from Southern Europe vs Immigrants from Sudan GED/Equivalency Correlation Chart
The statistical analysis conducted on geographies consisting of 402,804,595 people shows a weak positive correlation between the proportion of Immigrants from Southern Europe and percentage of population with at least ged/equivalency education in the United States with a correlation coefficient (R) of 0.226 and weighted average of 85.5%. Similarly, the statistical analysis conducted on geographies consisting of 118,959,807 people shows no correlation between the proportion of Immigrants from Sudan and percentage of population with at least ged/equivalency education in the United States with a correlation coefficient (R) of -0.040 and weighted average of 85.5%, a difference of 0.090%.
GED/Equivalency Correlation Summary
| Measurement | Immigrants from Southern Europe | Immigrants from Sudan |
| Minimum | 59.5% | 67.4% |
| Maximum | 100.0% | 100.0% |
| Range | 40.5% | 32.6% |
| Mean | 80.0% | 85.8% |
| Median | 81.2% | 86.2% |
| Interquartile 25% (IQ1) | 75.0% | 82.3% |
| Interquartile 75% (IQ3) | 85.6% | 88.7% |
| Interquartile Range (IQR) | 10.6% | 6.4% |
| Standard Deviation (Sample) | 8.7% | 6.6% |
| Standard Deviation (Population) | 8.6% | 6.5% |
Demographics Similar to Immigrants from Southern Europe and Immigrants from Sudan by GED/Equivalency
In terms of ged/equivalency, the demographic groups most similar to Immigrants from Southern Europe are Moroccan (85.5%, a difference of 0.020%), Aleut (85.6%, a difference of 0.040%), Korean (85.6%, a difference of 0.060%), Sudanese (85.5%, a difference of 0.070%), and Immigrants from Oceania (85.5%, a difference of 0.11%). Similarly, the demographic groups most similar to Immigrants from Sudan are Immigrants from Oceania (85.5%, a difference of 0.010%), Sudanese (85.5%, a difference of 0.020%), Spanish (85.4%, a difference of 0.030%), Spaniard (85.4%, a difference of 0.050%), and Moroccan (85.5%, a difference of 0.080%).
| Demographics | Rating | Rank | GED/Equivalency |
| Immigrants | Chile | 57.3 /100 | #171 | Average 85.9% |
| Bermudans | 55.1 /100 | #172 | Average 85.8% |
| Immigrants | Venezuela | 50.7 /100 | #173 | Average 85.8% |
| Ottawa | 50.0 /100 | #174 | Average 85.8% |
| Immigrants | Bolivia | 49.8 /100 | #175 | Average 85.8% |
| Immigrants | Eastern Africa | 47.7 /100 | #176 | Average 85.7% |
| Immigrants | Uganda | 45.2 /100 | #177 | Average 85.7% |
| Koreans | 41.2 /100 | #178 | Average 85.6% |
| Aleuts | 40.5 /100 | #179 | Average 85.6% |
| Immigrants | Southern Europe | 38.4 /100 | #180 | Fair 85.5% |
| Moroccans | 37.7 /100 | #181 | Fair 85.5% |
| Sudanese | 35.2 /100 | #182 | Fair 85.5% |
| Immigrants | Sudan | 34.2 /100 | #183 | Fair 85.5% |
| Immigrants | Oceania | 33.6 /100 | #184 | Fair 85.5% |
| Spanish | 32.8 /100 | #185 | Fair 85.4% |
| Spaniards | 31.9 /100 | #186 | Fair 85.4% |
| Immigrants | Afghanistan | 29.8 /100 | #187 | Fair 85.4% |
| Immigrants | Sierra Leone | 29.0 /100 | #188 | Fair 85.4% |
| Guamanians/Chamorros | 28.4 /100 | #189 | Fair 85.3% |
| Alaskan Athabascans | 27.5 /100 | #190 | Fair 85.3% |
| South American Indians | 22.8 /100 | #191 | Fair 85.2% |