Immigrants from Pakistan vs Croatian GED/Equivalency
COMPARE
Immigrants from Pakistan
Croatian
GED/Equivalency
GED/Equivalency Comparison
Immigrants from Pakistan
Croatians
86.4%
GED/EQUIVALENCY
82.4/ 100
METRIC RATING
143rd/ 347
METRIC RANK
88.8%
GED/EQUIVALENCY
99.9/ 100
METRIC RATING
17th/ 347
METRIC RANK
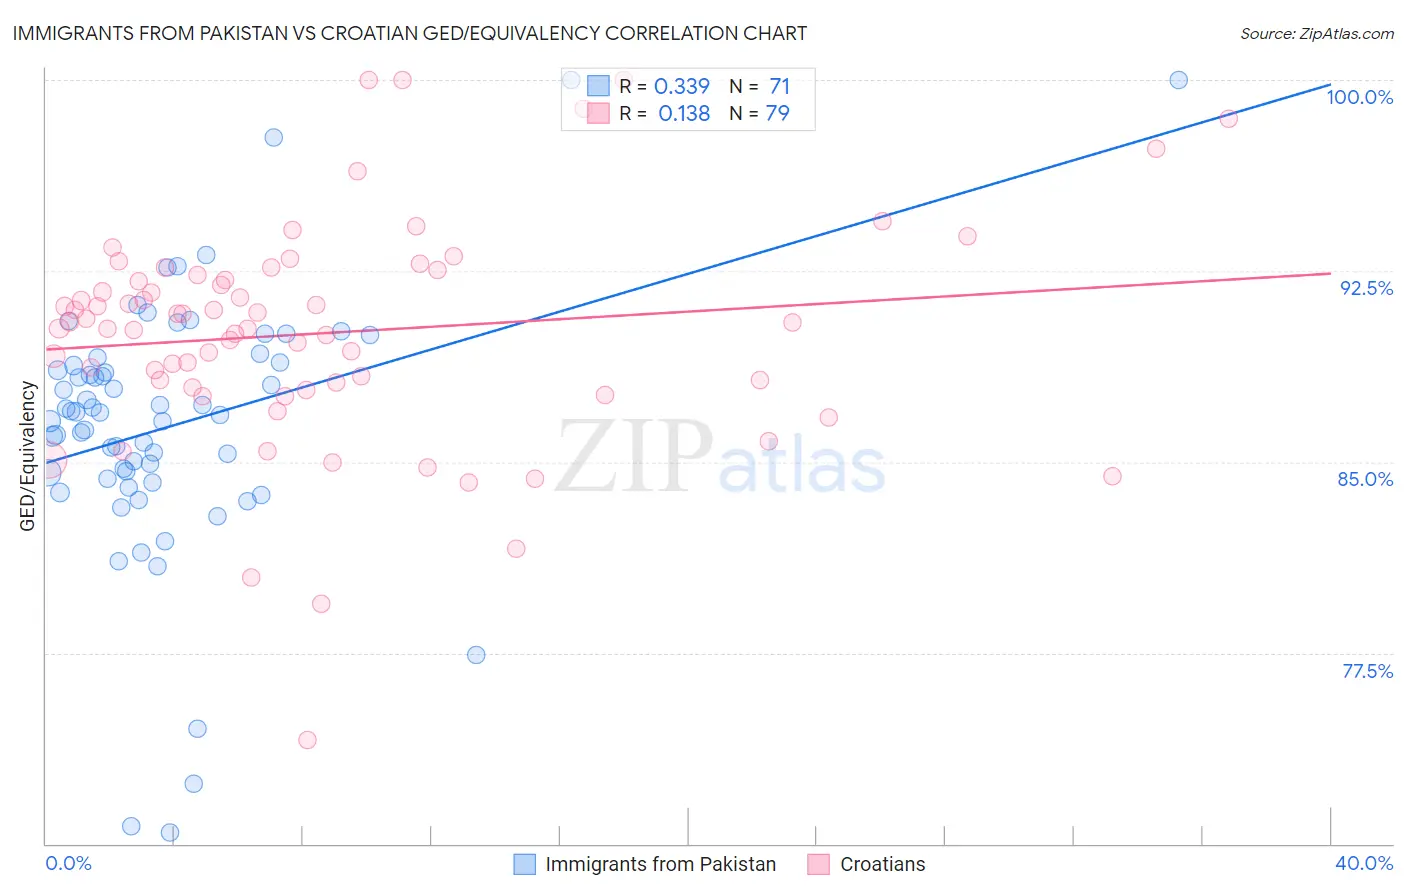
Immigrants from Pakistan vs Croatian GED/Equivalency Correlation Chart
The statistical analysis conducted on geographies consisting of 283,912,995 people shows a mild positive correlation between the proportion of Immigrants from Pakistan and percentage of population with at least ged/equivalency education in the United States with a correlation coefficient (R) of 0.339 and weighted average of 86.4%. Similarly, the statistical analysis conducted on geographies consisting of 375,732,690 people shows a poor positive correlation between the proportion of Croatians and percentage of population with at least ged/equivalency education in the United States with a correlation coefficient (R) of 0.138 and weighted average of 88.8%, a difference of 2.8%.
GED/Equivalency Correlation Summary
| Measurement | Immigrants from Pakistan | Croatian |
| Minimum | 70.4% | 74.1% |
| Maximum | 100.0% | 100.0% |
| Range | 29.6% | 25.9% |
| Mean | 86.4% | 90.1% |
| Median | 87.0% | 90.5% |
| Interquartile 25% (IQ1) | 84.4% | 87.9% |
| Interquartile 75% (IQ3) | 88.9% | 92.3% |
| Interquartile Range (IQR) | 4.5% | 4.4% |
| Standard Deviation (Sample) | 5.3% | 4.5% |
| Standard Deviation (Population) | 5.2% | 4.4% |
Similar Demographics by GED/Equivalency
Demographics Similar to Immigrants from Pakistan by GED/Equivalency
In terms of ged/equivalency, the demographic groups most similar to Immigrants from Pakistan are Immigrants from Indonesia (86.4%, a difference of 0.0%), Bolivian (86.4%, a difference of 0.010%), Laotian (86.5%, a difference of 0.030%), Paraguayan (86.5%, a difference of 0.060%), and Pakistani (86.4%, a difference of 0.070%).
| Demographics | Rating | Rank | GED/Equivalency |
| Chileans | 86.9 /100 | #136 | Excellent 86.6% |
| Arabs | 86.7 /100 | #137 | Excellent 86.6% |
| Immigrants | Argentina | 86.5 /100 | #138 | Excellent 86.6% |
| Immigrants | Malaysia | 85.0 /100 | #139 | Excellent 86.5% |
| Paraguayans | 84.1 /100 | #140 | Excellent 86.5% |
| Laotians | 83.2 /100 | #141 | Excellent 86.5% |
| Immigrants | Indonesia | 82.4 /100 | #142 | Excellent 86.4% |
| Immigrants | Pakistan | 82.4 /100 | #143 | Excellent 86.4% |
| Bolivians | 82.1 /100 | #144 | Excellent 86.4% |
| Pakistanis | 80.4 /100 | #145 | Excellent 86.4% |
| Basques | 79.5 /100 | #146 | Good 86.4% |
| Immigrants | Northern Africa | 79.3 /100 | #147 | Good 86.3% |
| Immigrants | Poland | 79.3 /100 | #148 | Good 86.3% |
| Menominee | 79.3 /100 | #149 | Good 86.3% |
| Immigrants | Western Asia | 78.8 /100 | #150 | Good 86.3% |
Demographics Similar to Croatians by GED/Equivalency
In terms of ged/equivalency, the demographic groups most similar to Croatians are Immigrants from Taiwan (88.8%, a difference of 0.030%), Slovene (88.8%, a difference of 0.030%), Okinawan (88.9%, a difference of 0.060%), Cypriot (88.9%, a difference of 0.080%), and Swedish (88.8%, a difference of 0.080%).
| Demographics | Rating | Rank | GED/Equivalency |
| Norwegians | 99.9 /100 | #10 | Exceptional 89.0% |
| Bulgarians | 99.9 /100 | #11 | Exceptional 89.0% |
| Lithuanians | 99.9 /100 | #12 | Exceptional 88.9% |
| Immigrants | Iran | 99.9 /100 | #13 | Exceptional 88.9% |
| Cypriots | 99.9 /100 | #14 | Exceptional 88.9% |
| Okinawans | 99.9 /100 | #15 | Exceptional 88.9% |
| Immigrants | Taiwan | 99.9 /100 | #16 | Exceptional 88.8% |
| Croatians | 99.9 /100 | #17 | Exceptional 88.8% |
| Slovenes | 99.9 /100 | #18 | Exceptional 88.8% |
| Swedes | 99.9 /100 | #19 | Exceptional 88.8% |
| Maltese | 99.9 /100 | #20 | Exceptional 88.6% |
| Luxembourgers | 99.8 /100 | #21 | Exceptional 88.6% |
| Immigrants | Ireland | 99.8 /100 | #22 | Exceptional 88.6% |
| Russians | 99.8 /100 | #23 | Exceptional 88.6% |
| Slovaks | 99.8 /100 | #24 | Exceptional 88.6% |