Slovene vs Immigrants from Sudan GED/Equivalency
COMPARE
Slovene
Immigrants from Sudan
GED/Equivalency
GED/Equivalency Comparison
Slovenes
Immigrants from Sudan
88.8%
GED/EQUIVALENCY
99.9/ 100
METRIC RATING
18th/ 347
METRIC RANK
85.5%
GED/EQUIVALENCY
34.2/ 100
METRIC RATING
183rd/ 347
METRIC RANK
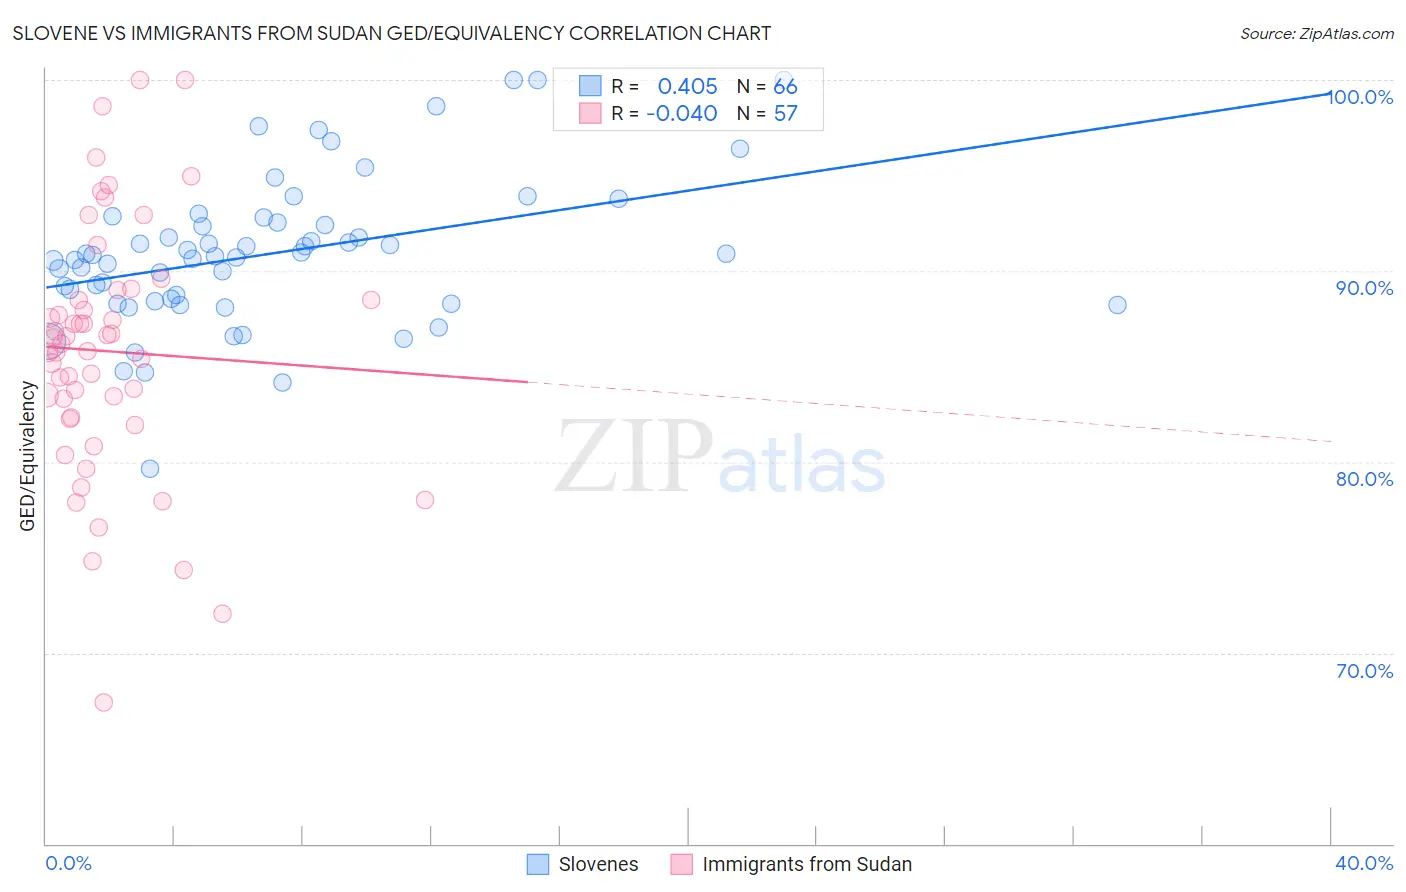
Slovene vs Immigrants from Sudan GED/Equivalency Correlation Chart
The statistical analysis conducted on geographies consisting of 261,353,399 people shows a moderate positive correlation between the proportion of Slovenes and percentage of population with at least ged/equivalency education in the United States with a correlation coefficient (R) of 0.405 and weighted average of 88.8%. Similarly, the statistical analysis conducted on geographies consisting of 118,959,807 people shows no correlation between the proportion of Immigrants from Sudan and percentage of population with at least ged/equivalency education in the United States with a correlation coefficient (R) of -0.040 and weighted average of 85.5%, a difference of 3.9%.
GED/Equivalency Correlation Summary
| Measurement | Slovene | Immigrants from Sudan |
| Minimum | 79.6% | 67.4% |
| Maximum | 100.0% | 100.0% |
| Range | 20.4% | 32.6% |
| Mean | 90.9% | 85.8% |
| Median | 90.8% | 86.2% |
| Interquartile 25% (IQ1) | 88.4% | 82.3% |
| Interquartile 75% (IQ3) | 92.5% | 88.7% |
| Interquartile Range (IQR) | 4.1% | 6.4% |
| Standard Deviation (Sample) | 3.9% | 6.6% |
| Standard Deviation (Population) | 3.9% | 6.5% |
Similar Demographics by GED/Equivalency
Demographics Similar to Slovenes by GED/Equivalency
In terms of ged/equivalency, the demographic groups most similar to Slovenes are Croatian (88.8%, a difference of 0.030%), Swedish (88.8%, a difference of 0.050%), Immigrants from Taiwan (88.8%, a difference of 0.060%), Okinawan (88.9%, a difference of 0.090%), and Cypriot (88.9%, a difference of 0.11%).
| Demographics | Rating | Rank | GED/Equivalency |
| Bulgarians | 99.9 /100 | #11 | Exceptional 89.0% |
| Lithuanians | 99.9 /100 | #12 | Exceptional 88.9% |
| Immigrants | Iran | 99.9 /100 | #13 | Exceptional 88.9% |
| Cypriots | 99.9 /100 | #14 | Exceptional 88.9% |
| Okinawans | 99.9 /100 | #15 | Exceptional 88.9% |
| Immigrants | Taiwan | 99.9 /100 | #16 | Exceptional 88.8% |
| Croatians | 99.9 /100 | #17 | Exceptional 88.8% |
| Slovenes | 99.9 /100 | #18 | Exceptional 88.8% |
| Swedes | 99.9 /100 | #19 | Exceptional 88.8% |
| Maltese | 99.9 /100 | #20 | Exceptional 88.6% |
| Luxembourgers | 99.8 /100 | #21 | Exceptional 88.6% |
| Immigrants | Ireland | 99.8 /100 | #22 | Exceptional 88.6% |
| Russians | 99.8 /100 | #23 | Exceptional 88.6% |
| Slovaks | 99.8 /100 | #24 | Exceptional 88.6% |
| Estonians | 99.8 /100 | #25 | Exceptional 88.6% |
Demographics Similar to Immigrants from Sudan by GED/Equivalency
In terms of ged/equivalency, the demographic groups most similar to Immigrants from Sudan are Immigrants from Oceania (85.5%, a difference of 0.010%), Sudanese (85.5%, a difference of 0.020%), Spanish (85.4%, a difference of 0.030%), Spaniard (85.4%, a difference of 0.050%), and Moroccan (85.5%, a difference of 0.080%).
| Demographics | Rating | Rank | GED/Equivalency |
| Immigrants | Eastern Africa | 47.7 /100 | #176 | Average 85.7% |
| Immigrants | Uganda | 45.2 /100 | #177 | Average 85.7% |
| Koreans | 41.2 /100 | #178 | Average 85.6% |
| Aleuts | 40.5 /100 | #179 | Average 85.6% |
| Immigrants | Southern Europe | 38.4 /100 | #180 | Fair 85.5% |
| Moroccans | 37.7 /100 | #181 | Fair 85.5% |
| Sudanese | 35.2 /100 | #182 | Fair 85.5% |
| Immigrants | Sudan | 34.2 /100 | #183 | Fair 85.5% |
| Immigrants | Oceania | 33.6 /100 | #184 | Fair 85.5% |
| Spanish | 32.8 /100 | #185 | Fair 85.4% |
| Spaniards | 31.9 /100 | #186 | Fair 85.4% |
| Immigrants | Afghanistan | 29.8 /100 | #187 | Fair 85.4% |
| Immigrants | Sierra Leone | 29.0 /100 | #188 | Fair 85.4% |
| Guamanians/Chamorros | 28.4 /100 | #189 | Fair 85.3% |
| Alaskan Athabascans | 27.5 /100 | #190 | Fair 85.3% |