Immigrants from Pakistan vs African GED/Equivalency
COMPARE
Immigrants from Pakistan
African
GED/Equivalency
GED/Equivalency Comparison
Immigrants from Pakistan
Africans
86.4%
GED/EQUIVALENCY
82.4/ 100
METRIC RATING
143rd/ 347
METRIC RANK
83.4%
GED/EQUIVALENCY
0.5/ 100
METRIC RATING
256th/ 347
METRIC RANK
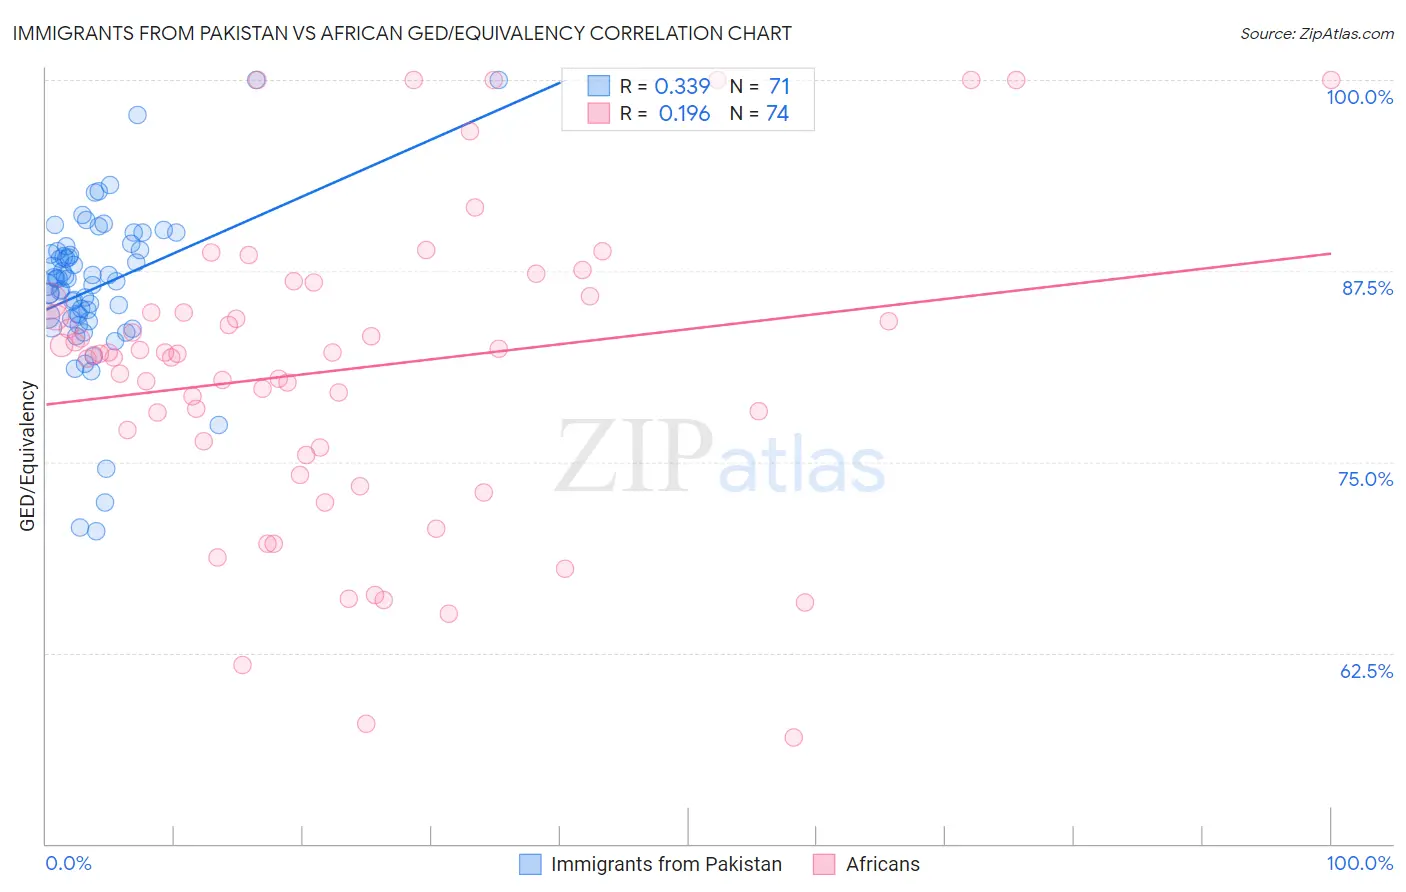
Immigrants from Pakistan vs African GED/Equivalency Correlation Chart
The statistical analysis conducted on geographies consisting of 283,912,995 people shows a mild positive correlation between the proportion of Immigrants from Pakistan and percentage of population with at least ged/equivalency education in the United States with a correlation coefficient (R) of 0.339 and weighted average of 86.4%. Similarly, the statistical analysis conducted on geographies consisting of 470,092,963 people shows a poor positive correlation between the proportion of Africans and percentage of population with at least ged/equivalency education in the United States with a correlation coefficient (R) of 0.196 and weighted average of 83.4%, a difference of 3.6%.
GED/Equivalency Correlation Summary
| Measurement | Immigrants from Pakistan | African |
| Minimum | 70.4% | 56.9% |
| Maximum | 100.0% | 100.0% |
| Range | 29.6% | 43.1% |
| Mean | 86.4% | 81.0% |
| Median | 87.0% | 82.1% |
| Interquartile 25% (IQ1) | 84.4% | 75.9% |
| Interquartile 75% (IQ3) | 88.9% | 85.5% |
| Interquartile Range (IQR) | 4.5% | 9.6% |
| Standard Deviation (Sample) | 5.3% | 9.9% |
| Standard Deviation (Population) | 5.2% | 9.8% |
Similar Demographics by GED/Equivalency
Demographics Similar to Immigrants from Pakistan by GED/Equivalency
In terms of ged/equivalency, the demographic groups most similar to Immigrants from Pakistan are Immigrants from Indonesia (86.4%, a difference of 0.0%), Bolivian (86.4%, a difference of 0.010%), Laotian (86.5%, a difference of 0.030%), Paraguayan (86.5%, a difference of 0.060%), and Pakistani (86.4%, a difference of 0.070%).
| Demographics | Rating | Rank | GED/Equivalency |
| Chileans | 86.9 /100 | #136 | Excellent 86.6% |
| Arabs | 86.7 /100 | #137 | Excellent 86.6% |
| Immigrants | Argentina | 86.5 /100 | #138 | Excellent 86.6% |
| Immigrants | Malaysia | 85.0 /100 | #139 | Excellent 86.5% |
| Paraguayans | 84.1 /100 | #140 | Excellent 86.5% |
| Laotians | 83.2 /100 | #141 | Excellent 86.5% |
| Immigrants | Indonesia | 82.4 /100 | #142 | Excellent 86.4% |
| Immigrants | Pakistan | 82.4 /100 | #143 | Excellent 86.4% |
| Bolivians | 82.1 /100 | #144 | Excellent 86.4% |
| Pakistanis | 80.4 /100 | #145 | Excellent 86.4% |
| Basques | 79.5 /100 | #146 | Good 86.4% |
| Immigrants | Northern Africa | 79.3 /100 | #147 | Good 86.3% |
| Immigrants | Poland | 79.3 /100 | #148 | Good 86.3% |
| Menominee | 79.3 /100 | #149 | Good 86.3% |
| Immigrants | Western Asia | 78.8 /100 | #150 | Good 86.3% |
Demographics Similar to Africans by GED/Equivalency
In terms of ged/equivalency, the demographic groups most similar to Africans are Colville (83.4%, a difference of 0.010%), Jamaican (83.3%, a difference of 0.13%), Malaysian (83.3%, a difference of 0.16%), Creek (83.6%, a difference of 0.18%), and Comanche (83.6%, a difference of 0.20%).
| Demographics | Rating | Rank | GED/Equivalency |
| Crow | 1.1 /100 | #249 | Tragic 83.8% |
| Shoshone | 1.0 /100 | #250 | Tragic 83.7% |
| Spanish Americans | 0.8 /100 | #251 | Tragic 83.6% |
| Bahamians | 0.8 /100 | #252 | Tragic 83.6% |
| Comanche | 0.7 /100 | #253 | Tragic 83.6% |
| Creek | 0.7 /100 | #254 | Tragic 83.6% |
| Colville | 0.5 /100 | #255 | Tragic 83.4% |
| Africans | 0.5 /100 | #256 | Tragic 83.4% |
| Jamaicans | 0.4 /100 | #257 | Tragic 83.3% |
| Malaysians | 0.4 /100 | #258 | Tragic 83.3% |
| Immigrants | Vietnam | 0.3 /100 | #259 | Tragic 83.2% |
| Choctaw | 0.3 /100 | #260 | Tragic 83.1% |
| Inupiat | 0.2 /100 | #261 | Tragic 83.1% |
| Immigrants | Armenia | 0.2 /100 | #262 | Tragic 83.1% |
| Immigrants | Congo | 0.2 /100 | #263 | Tragic 83.1% |