Chinese vs Immigrants from Sudan GED/Equivalency
COMPARE
Chinese
Immigrants from Sudan
GED/Equivalency
GED/Equivalency Comparison
Chinese
Immigrants from Sudan
89.0%
GED/EQUIVALENCY
99.9/ 100
METRIC RATING
9th/ 347
METRIC RANK
85.5%
GED/EQUIVALENCY
34.2/ 100
METRIC RATING
183rd/ 347
METRIC RANK
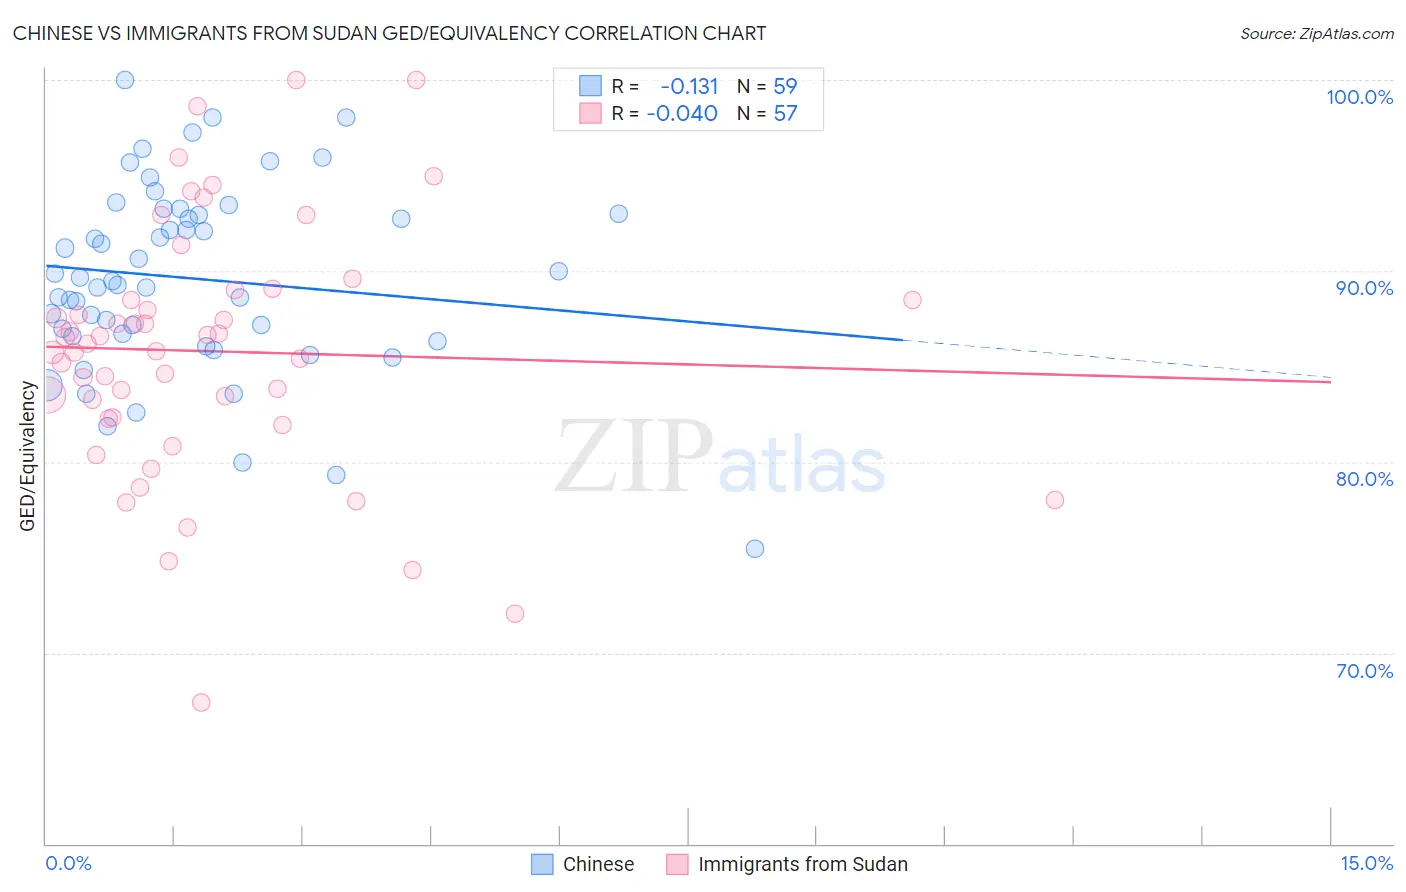
Chinese vs Immigrants from Sudan GED/Equivalency Correlation Chart
The statistical analysis conducted on geographies consisting of 64,809,883 people shows a poor negative correlation between the proportion of Chinese and percentage of population with at least ged/equivalency education in the United States with a correlation coefficient (R) of -0.131 and weighted average of 89.0%. Similarly, the statistical analysis conducted on geographies consisting of 118,959,807 people shows no correlation between the proportion of Immigrants from Sudan and percentage of population with at least ged/equivalency education in the United States with a correlation coefficient (R) of -0.040 and weighted average of 85.5%, a difference of 4.2%.
GED/Equivalency Correlation Summary
| Measurement | Chinese | Immigrants from Sudan |
| Minimum | 75.4% | 67.4% |
| Maximum | 100.0% | 100.0% |
| Range | 24.6% | 32.6% |
| Mean | 89.6% | 85.8% |
| Median | 89.4% | 86.2% |
| Interquartile 25% (IQ1) | 86.6% | 82.3% |
| Interquartile 75% (IQ3) | 93.0% | 88.7% |
| Interquartile Range (IQR) | 6.5% | 6.4% |
| Standard Deviation (Sample) | 4.9% | 6.6% |
| Standard Deviation (Population) | 4.9% | 6.5% |
Similar Demographics by GED/Equivalency
Demographics Similar to Chinese by GED/Equivalency
In terms of ged/equivalency, the demographic groups most similar to Chinese are Carpatho Rusyn (89.1%, a difference of 0.020%), Norwegian (89.0%, a difference of 0.040%), Eastern European (89.1%, a difference of 0.070%), Bulgarian (89.0%, a difference of 0.080%), and Thai (89.1%, a difference of 0.12%).
| Demographics | Rating | Rank | GED/Equivalency |
| Filipinos | 100.0 /100 | #2 | Exceptional 89.5% |
| Immigrants | Singapore | 100.0 /100 | #3 | Exceptional 89.3% |
| Iranians | 100.0 /100 | #4 | Exceptional 89.2% |
| Latvians | 100.0 /100 | #5 | Exceptional 89.2% |
| Thais | 100.0 /100 | #6 | Exceptional 89.1% |
| Eastern Europeans | 99.9 /100 | #7 | Exceptional 89.1% |
| Carpatho Rusyns | 99.9 /100 | #8 | Exceptional 89.1% |
| Chinese | 99.9 /100 | #9 | Exceptional 89.0% |
| Norwegians | 99.9 /100 | #10 | Exceptional 89.0% |
| Bulgarians | 99.9 /100 | #11 | Exceptional 89.0% |
| Lithuanians | 99.9 /100 | #12 | Exceptional 88.9% |
| Immigrants | Iran | 99.9 /100 | #13 | Exceptional 88.9% |
| Cypriots | 99.9 /100 | #14 | Exceptional 88.9% |
| Okinawans | 99.9 /100 | #15 | Exceptional 88.9% |
| Immigrants | Taiwan | 99.9 /100 | #16 | Exceptional 88.8% |
Demographics Similar to Immigrants from Sudan by GED/Equivalency
In terms of ged/equivalency, the demographic groups most similar to Immigrants from Sudan are Immigrants from Oceania (85.5%, a difference of 0.010%), Sudanese (85.5%, a difference of 0.020%), Spanish (85.4%, a difference of 0.030%), Spaniard (85.4%, a difference of 0.050%), and Moroccan (85.5%, a difference of 0.080%).
| Demographics | Rating | Rank | GED/Equivalency |
| Immigrants | Eastern Africa | 47.7 /100 | #176 | Average 85.7% |
| Immigrants | Uganda | 45.2 /100 | #177 | Average 85.7% |
| Koreans | 41.2 /100 | #178 | Average 85.6% |
| Aleuts | 40.5 /100 | #179 | Average 85.6% |
| Immigrants | Southern Europe | 38.4 /100 | #180 | Fair 85.5% |
| Moroccans | 37.7 /100 | #181 | Fair 85.5% |
| Sudanese | 35.2 /100 | #182 | Fair 85.5% |
| Immigrants | Sudan | 34.2 /100 | #183 | Fair 85.5% |
| Immigrants | Oceania | 33.6 /100 | #184 | Fair 85.5% |
| Spanish | 32.8 /100 | #185 | Fair 85.4% |
| Spaniards | 31.9 /100 | #186 | Fair 85.4% |
| Immigrants | Afghanistan | 29.8 /100 | #187 | Fair 85.4% |
| Immigrants | Sierra Leone | 29.0 /100 | #188 | Fair 85.4% |
| Guamanians/Chamorros | 28.4 /100 | #189 | Fair 85.3% |
| Alaskan Athabascans | 27.5 /100 | #190 | Fair 85.3% |