Immigrants from Micronesia vs White/Caucasian Female Poverty Among 25-34 Year Olds
COMPARE
Immigrants from Micronesia
White/Caucasian
Female Poverty Among 25-34 Year Olds
Female Poverty Among 25-34 Year Olds Comparison
Immigrants from Micronesia
Whites/Caucasians
15.8%
FEMALE POVERTY AMONG 25-34 YEAR OLDS
0.0/ 100
METRIC RATING
277th/ 347
METRIC RANK
14.7%
FEMALE POVERTY AMONG 25-34 YEAR OLDS
1.8/ 100
METRIC RATING
233rd/ 347
METRIC RANK
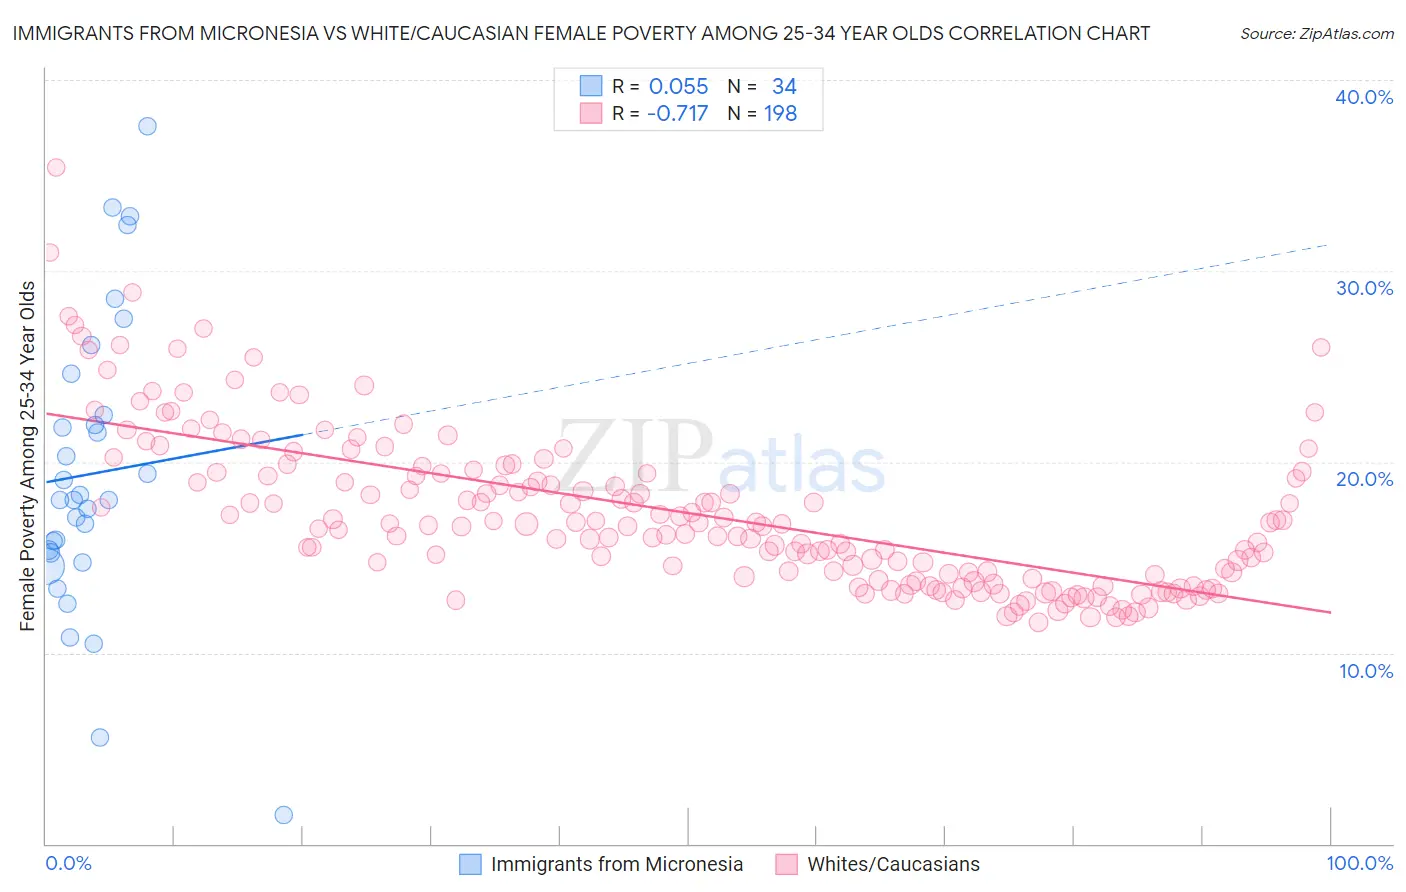
Immigrants from Micronesia vs White/Caucasian Female Poverty Among 25-34 Year Olds Correlation Chart
The statistical analysis conducted on geographies consisting of 61,523,063 people shows a slight positive correlation between the proportion of Immigrants from Micronesia and poverty level among females between the ages 25 and 34 in the United States with a correlation coefficient (R) of 0.055 and weighted average of 15.8%. Similarly, the statistical analysis conducted on geographies consisting of 558,401,986 people shows a strong negative correlation between the proportion of Whites/Caucasians and poverty level among females between the ages 25 and 34 in the United States with a correlation coefficient (R) of -0.717 and weighted average of 14.7%, a difference of 8.0%.
Female Poverty Among 25-34 Year Olds Correlation Summary
| Measurement | Immigrants from Micronesia | White/Caucasian |
| Minimum | 1.5% | 11.6% |
| Maximum | 37.5% | 35.4% |
| Range | 36.0% | 23.8% |
| Mean | 19.4% | 17.3% |
| Median | 18.0% | 16.7% |
| Interquartile 25% (IQ1) | 15.2% | 13.9% |
| Interquartile 75% (IQ3) | 22.4% | 19.4% |
| Interquartile Range (IQR) | 7.2% | 5.6% |
| Standard Deviation (Sample) | 7.8% | 4.2% |
| Standard Deviation (Population) | 7.7% | 4.2% |
Similar Demographics by Female Poverty Among 25-34 Year Olds
Demographics Similar to Immigrants from Micronesia by Female Poverty Among 25-34 Year Olds
In terms of female poverty among 25-34 year olds, the demographic groups most similar to Immigrants from Micronesia are Immigrants from Zaire (15.8%, a difference of 0.010%), French American Indian (15.9%, a difference of 0.29%), Fijian (15.9%, a difference of 0.29%), Immigrants from the Azores (15.8%, a difference of 0.44%), and Bangladeshi (15.9%, a difference of 0.45%).
| Demographics | Rating | Rank | Female Poverty Among 25-34 Year Olds |
| British West Indians | 0.1 /100 | #270 | Tragic 15.6% |
| Cree | 0.1 /100 | #271 | Tragic 15.6% |
| Senegalese | 0.1 /100 | #272 | Tragic 15.6% |
| Immigrants | Nonimmigrants | 0.1 /100 | #273 | Tragic 15.6% |
| Immigrants | Caribbean | 0.0 /100 | #274 | Tragic 15.7% |
| Immigrants | Azores | 0.0 /100 | #275 | Tragic 15.8% |
| Immigrants | Zaire | 0.0 /100 | #276 | Tragic 15.8% |
| Immigrants | Micronesia | 0.0 /100 | #277 | Tragic 15.8% |
| French American Indians | 0.0 /100 | #278 | Tragic 15.9% |
| Fijians | 0.0 /100 | #279 | Tragic 15.9% |
| Bangladeshis | 0.0 /100 | #280 | Tragic 15.9% |
| Immigrants | Latin America | 0.0 /100 | #281 | Tragic 16.0% |
| Aleuts | 0.0 /100 | #282 | Tragic 16.1% |
| Bahamians | 0.0 /100 | #283 | Tragic 16.1% |
| Shoshone | 0.0 /100 | #284 | Tragic 16.2% |
Demographics Similar to Whites/Caucasians by Female Poverty Among 25-34 Year Olds
In terms of female poverty among 25-34 year olds, the demographic groups most similar to Whites/Caucasians are Immigrants from Ecuador (14.6%, a difference of 0.18%), Cuban (14.7%, a difference of 0.23%), Immigrants from Jamaica (14.7%, a difference of 0.41%), Salvadoran (14.7%, a difference of 0.43%), and Immigrants from Ghana (14.7%, a difference of 0.43%).
| Demographics | Rating | Rank | Female Poverty Among 25-34 Year Olds |
| Nicaraguans | 3.3 /100 | #226 | Tragic 14.5% |
| Celtics | 2.8 /100 | #227 | Tragic 14.5% |
| Vietnamese | 2.6 /100 | #228 | Tragic 14.6% |
| Spanish | 2.5 /100 | #229 | Tragic 14.6% |
| Spaniards | 2.3 /100 | #230 | Tragic 14.6% |
| Delaware | 2.3 /100 | #231 | Tragic 14.6% |
| Immigrants | Ecuador | 1.9 /100 | #232 | Tragic 14.6% |
| Whites/Caucasians | 1.8 /100 | #233 | Tragic 14.7% |
| Cubans | 1.6 /100 | #234 | Tragic 14.7% |
| Immigrants | Jamaica | 1.4 /100 | #235 | Tragic 14.7% |
| Salvadorans | 1.4 /100 | #236 | Tragic 14.7% |
| Immigrants | Ghana | 1.4 /100 | #237 | Tragic 14.7% |
| Alsatians | 1.4 /100 | #238 | Tragic 14.7% |
| Malaysians | 1.4 /100 | #239 | Tragic 14.7% |
| Immigrants | Grenada | 1.3 /100 | #240 | Tragic 14.7% |