Immigrants from Norway vs White/Caucasian GED/Equivalency
COMPARE
Immigrants from Norway
White/Caucasian
GED/Equivalency
GED/Equivalency Comparison
Immigrants from Norway
Whites/Caucasians
87.5%
GED/EQUIVALENCY
98.1/ 100
METRIC RATING
88th/ 347
METRIC RANK
86.2%
GED/EQUIVALENCY
72.2/ 100
METRIC RATING
157th/ 347
METRIC RANK
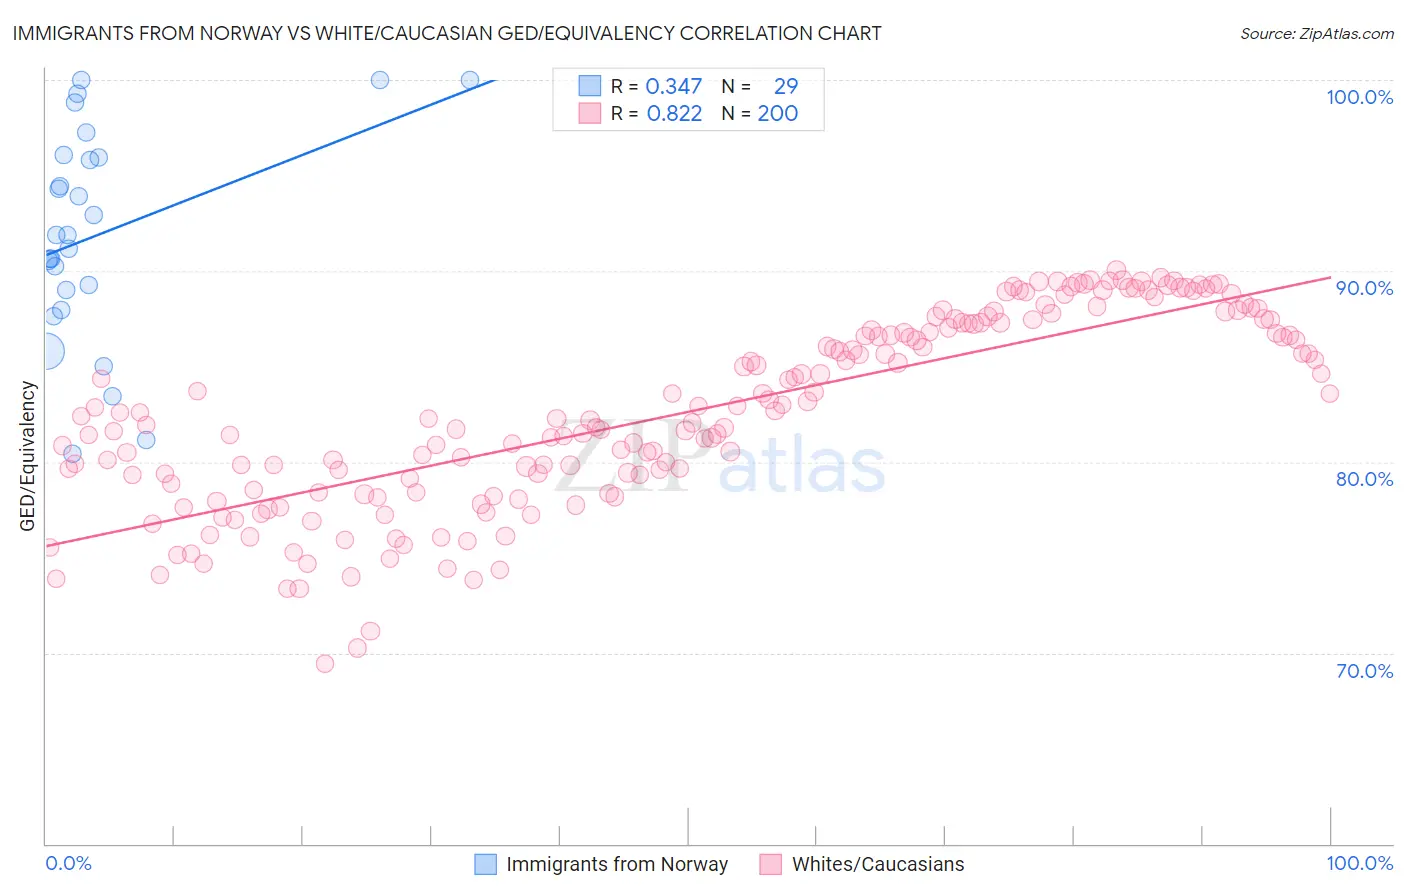
Immigrants from Norway vs White/Caucasian GED/Equivalency Correlation Chart
The statistical analysis conducted on geographies consisting of 116,716,420 people shows a mild positive correlation between the proportion of Immigrants from Norway and percentage of population with at least ged/equivalency education in the United States with a correlation coefficient (R) of 0.347 and weighted average of 87.5%. Similarly, the statistical analysis conducted on geographies consisting of 585,240,437 people shows a very strong positive correlation between the proportion of Whites/Caucasians and percentage of population with at least ged/equivalency education in the United States with a correlation coefficient (R) of 0.822 and weighted average of 86.2%, a difference of 1.5%.
GED/Equivalency Correlation Summary
| Measurement | Immigrants from Norway | White/Caucasian |
| Minimum | 80.4% | 69.4% |
| Maximum | 100.0% | 90.1% |
| Range | 19.6% | 20.6% |
| Mean | 91.9% | 82.6% |
| Median | 91.9% | 82.5% |
| Interquartile 25% (IQ1) | 88.5% | 79.0% |
| Interquartile 75% (IQ3) | 96.0% | 87.3% |
| Interquartile Range (IQR) | 7.6% | 8.3% |
| Standard Deviation (Sample) | 5.5% | 5.0% |
| Standard Deviation (Population) | 5.4% | 4.9% |
Similar Demographics by GED/Equivalency
Demographics Similar to Immigrants from Norway by GED/Equivalency
In terms of ged/equivalency, the demographic groups most similar to Immigrants from Norway are Immigrants from Europe (87.5%, a difference of 0.010%), Native Hawaiian (87.5%, a difference of 0.010%), Immigrants from Romania (87.5%, a difference of 0.020%), Dutch (87.5%, a difference of 0.020%), and Hungarian (87.4%, a difference of 0.040%).
| Demographics | Rating | Rank | GED/Equivalency |
| Immigrants | Sri Lanka | 98.3 /100 | #81 | Exceptional 87.5% |
| Romanians | 98.3 /100 | #82 | Exceptional 87.5% |
| South Africans | 98.3 /100 | #83 | Exceptional 87.5% |
| Immigrants | Romania | 98.1 /100 | #84 | Exceptional 87.5% |
| Dutch | 98.1 /100 | #85 | Exceptional 87.5% |
| Immigrants | Europe | 98.1 /100 | #86 | Exceptional 87.5% |
| Native Hawaiians | 98.1 /100 | #87 | Exceptional 87.5% |
| Immigrants | Norway | 98.1 /100 | #88 | Exceptional 87.5% |
| Hungarians | 97.9 /100 | #89 | Exceptional 87.4% |
| Welsh | 97.9 /100 | #90 | Exceptional 87.4% |
| Immigrants | Eastern Asia | 97.9 /100 | #91 | Exceptional 87.4% |
| Israelis | 97.8 /100 | #92 | Exceptional 87.4% |
| Immigrants | North Macedonia | 97.8 /100 | #93 | Exceptional 87.4% |
| Immigrants | Russia | 97.8 /100 | #94 | Exceptional 87.4% |
| Immigrants | Greece | 97.7 /100 | #95 | Exceptional 87.4% |
Demographics Similar to Whites/Caucasians by GED/Equivalency
In terms of ged/equivalency, the demographic groups most similar to Whites/Caucasians are German Russian (86.2%, a difference of 0.0%), Immigrants from Kenya (86.2%, a difference of 0.010%), Immigrants from Nepal (86.2%, a difference of 0.030%), Immigrants from Morocco (86.1%, a difference of 0.070%), and Immigrants from Syria (86.1%, a difference of 0.070%).
| Demographics | Rating | Rank | GED/Equivalency |
| Immigrants | Western Asia | 78.8 /100 | #150 | Good 86.3% |
| Immigrants | Bosnia and Herzegovina | 77.9 /100 | #151 | Good 86.3% |
| Brazilians | 77.2 /100 | #152 | Good 86.3% |
| Kenyans | 76.6 /100 | #153 | Good 86.3% |
| Armenians | 76.4 /100 | #154 | Good 86.3% |
| Iraqis | 75.2 /100 | #155 | Good 86.2% |
| Immigrants | Nepal | 73.3 /100 | #156 | Good 86.2% |
| Whites/Caucasians | 72.2 /100 | #157 | Good 86.2% |
| German Russians | 72.1 /100 | #158 | Good 86.2% |
| Immigrants | Kenya | 71.8 /100 | #159 | Good 86.2% |
| Immigrants | Morocco | 69.5 /100 | #160 | Good 86.1% |
| Immigrants | Syria | 69.3 /100 | #161 | Good 86.1% |
| Immigrants | Iraq | 68.1 /100 | #162 | Good 86.1% |
| Ugandans | 66.3 /100 | #163 | Good 86.1% |
| Venezuelans | 65.5 /100 | #164 | Good 86.0% |