Immigrants from Laos vs Chilean College, Under 1 year
COMPARE
Immigrants from Laos
Chilean
College, Under 1 year
College, Under 1 year Comparison
Immigrants from Laos
Chileans
61.3%
COLLEGE, UNDER 1 YEAR
0.3/ 100
METRIC RATING
257th/ 347
METRIC RANK
67.6%
COLLEGE, UNDER 1 YEAR
95.3/ 100
METRIC RATING
114th/ 347
METRIC RANK
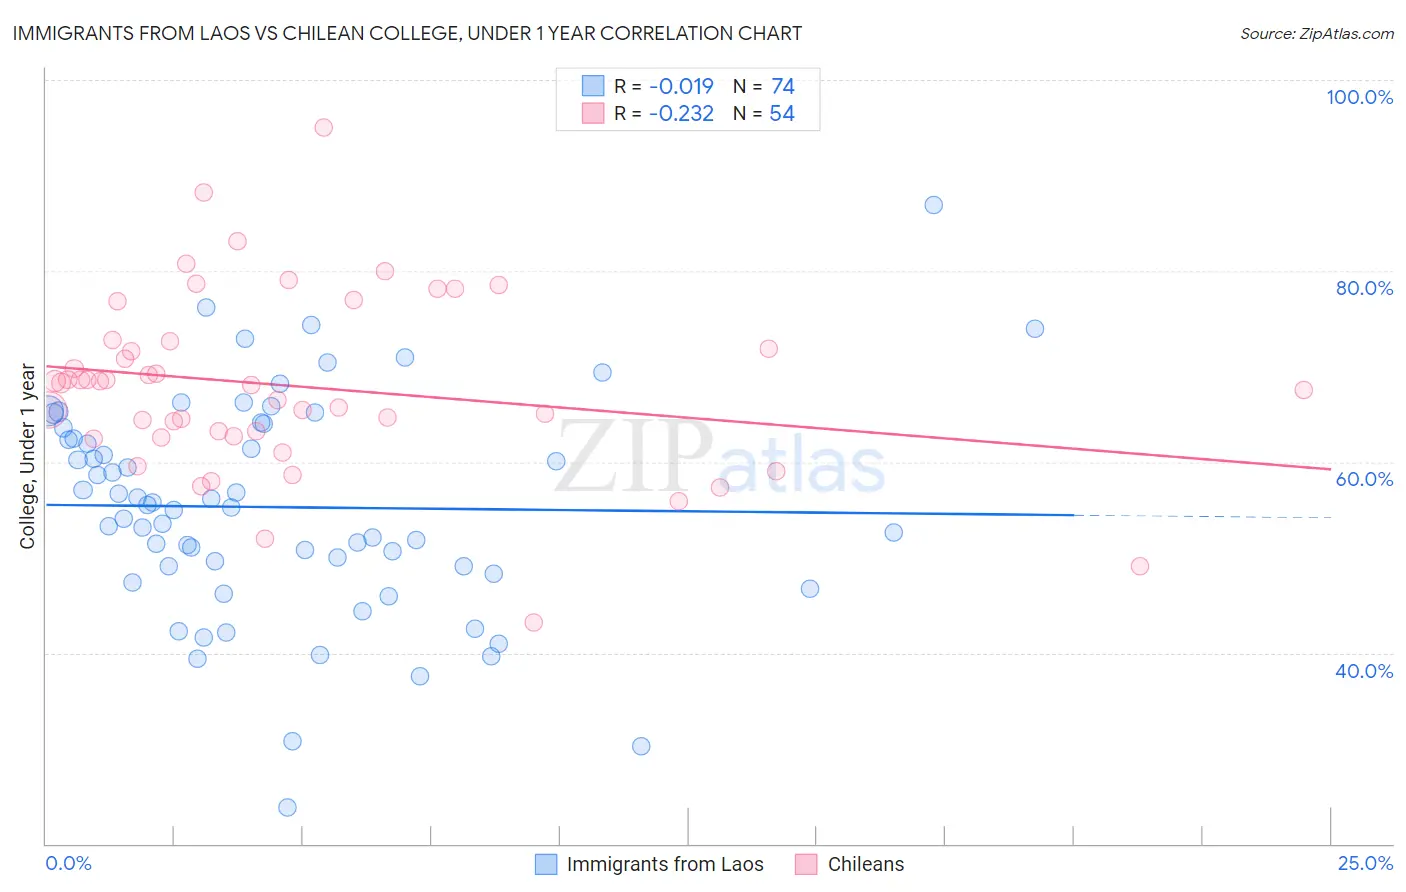
Immigrants from Laos vs Chilean College, Under 1 year Correlation Chart
The statistical analysis conducted on geographies consisting of 201,475,732 people shows no correlation between the proportion of Immigrants from Laos and percentage of population with at least college, under 1 year education in the United States with a correlation coefficient (R) of -0.019 and weighted average of 61.3%. Similarly, the statistical analysis conducted on geographies consisting of 256,681,764 people shows a weak negative correlation between the proportion of Chileans and percentage of population with at least college, under 1 year education in the United States with a correlation coefficient (R) of -0.232 and weighted average of 67.6%, a difference of 10.2%.
College, Under 1 year Correlation Summary
| Measurement | Immigrants from Laos | Chilean |
| Minimum | 23.8% | 43.2% |
| Maximum | 86.9% | 95.0% |
| Range | 63.2% | 51.9% |
| Mean | 55.2% | 67.9% |
| Median | 55.3% | 68.2% |
| Interquartile 25% (IQ1) | 49.0% | 62.7% |
| Interquartile 75% (IQ3) | 63.6% | 72.6% |
| Interquartile Range (IQR) | 14.5% | 10.0% |
| Standard Deviation (Sample) | 11.4% | 9.4% |
| Standard Deviation (Population) | 11.4% | 9.3% |
Similar Demographics by College, Under 1 year
Demographics Similar to Immigrants from Laos by College, Under 1 year
In terms of college, under 1 year, the demographic groups most similar to Immigrants from Laos are Immigrants from Bangladesh (61.3%, a difference of 0.060%), Indonesian (61.2%, a difference of 0.080%), Bangladeshi (61.4%, a difference of 0.11%), Comanche (61.4%, a difference of 0.16%), and Blackfeet (61.1%, a difference of 0.25%).
| Demographics | Rating | Rank | College, Under 1 year |
| Immigrants | Congo | 0.5 /100 | #250 | Tragic 61.7% |
| Immigrants | Micronesia | 0.5 /100 | #251 | Tragic 61.5% |
| West Indians | 0.4 /100 | #252 | Tragic 61.5% |
| Japanese | 0.4 /100 | #253 | Tragic 61.5% |
| Immigrants | Cambodia | 0.4 /100 | #254 | Tragic 61.5% |
| Comanche | 0.4 /100 | #255 | Tragic 61.4% |
| Bangladeshis | 0.4 /100 | #256 | Tragic 61.4% |
| Immigrants | Laos | 0.3 /100 | #257 | Tragic 61.3% |
| Immigrants | Bangladesh | 0.3 /100 | #258 | Tragic 61.3% |
| Indonesians | 0.3 /100 | #259 | Tragic 61.2% |
| Blackfeet | 0.3 /100 | #260 | Tragic 61.1% |
| Africans | 0.3 /100 | #261 | Tragic 61.1% |
| Barbadians | 0.2 /100 | #262 | Tragic 61.1% |
| Shoshone | 0.2 /100 | #263 | Tragic 61.1% |
| Trinidadians and Tobagonians | 0.2 /100 | #264 | Tragic 61.1% |
Demographics Similar to Chileans by College, Under 1 year
In terms of college, under 1 year, the demographic groups most similar to Chileans are Basque (67.6%, a difference of 0.010%), Syrian (67.6%, a difference of 0.080%), Immigrants from Nepal (67.5%, a difference of 0.090%), Macedonian (67.6%, a difference of 0.10%), and Pakistani (67.5%, a difference of 0.11%).
| Demographics | Rating | Rank | College, Under 1 year |
| Austrians | 96.4 /100 | #107 | Exceptional 67.8% |
| Immigrants | Egypt | 96.0 /100 | #108 | Exceptional 67.7% |
| Scandinavians | 95.8 /100 | #109 | Exceptional 67.7% |
| Assyrians/Chaldeans/Syriacs | 95.8 /100 | #110 | Exceptional 67.7% |
| Ukrainians | 95.8 /100 | #111 | Exceptional 67.7% |
| Macedonians | 95.7 /100 | #112 | Exceptional 67.6% |
| Syrians | 95.6 /100 | #113 | Exceptional 67.6% |
| Chileans | 95.3 /100 | #114 | Exceptional 67.6% |
| Basques | 95.2 /100 | #115 | Exceptional 67.6% |
| Immigrants | Nepal | 94.9 /100 | #116 | Exceptional 67.5% |
| Pakistanis | 94.8 /100 | #117 | Exceptional 67.5% |
| Immigrants | Ukraine | 94.7 /100 | #118 | Exceptional 67.5% |
| Lebanese | 94.6 /100 | #119 | Exceptional 67.5% |
| Serbians | 93.9 /100 | #120 | Exceptional 67.4% |
| Slovenes | 93.3 /100 | #121 | Exceptional 67.3% |