Guyanese vs Chilean College, Under 1 year
COMPARE
Guyanese
Chilean
College, Under 1 year
College, Under 1 year Comparison
Guyanese
Chileans
59.0%
COLLEGE, UNDER 1 YEAR
0.0/ 100
METRIC RATING
297th/ 347
METRIC RANK
67.6%
COLLEGE, UNDER 1 YEAR
95.3/ 100
METRIC RATING
114th/ 347
METRIC RANK
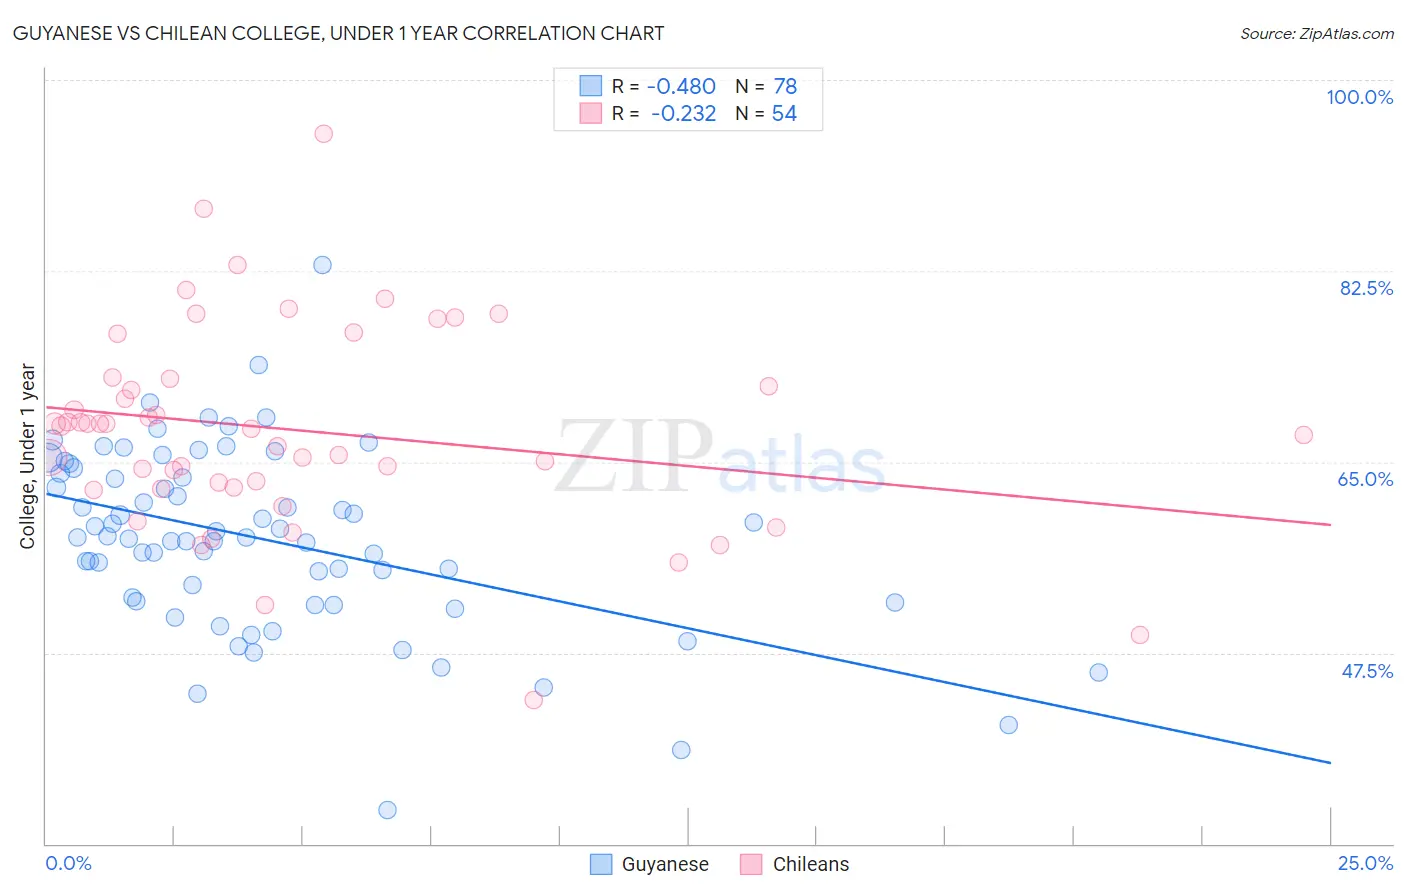
Guyanese vs Chilean College, Under 1 year Correlation Chart
The statistical analysis conducted on geographies consisting of 176,940,589 people shows a moderate negative correlation between the proportion of Guyanese and percentage of population with at least college, under 1 year education in the United States with a correlation coefficient (R) of -0.480 and weighted average of 59.0%. Similarly, the statistical analysis conducted on geographies consisting of 256,681,764 people shows a weak negative correlation between the proportion of Chileans and percentage of population with at least college, under 1 year education in the United States with a correlation coefficient (R) of -0.232 and weighted average of 67.6%, a difference of 14.5%.
College, Under 1 year Correlation Summary
| Measurement | Guyanese | Chilean |
| Minimum | 33.1% | 43.2% |
| Maximum | 83.1% | 95.0% |
| Range | 50.0% | 51.9% |
| Mean | 57.9% | 67.9% |
| Median | 58.1% | 68.2% |
| Interquartile 25% (IQ1) | 52.3% | 62.7% |
| Interquartile 75% (IQ3) | 64.0% | 72.6% |
| Interquartile Range (IQR) | 11.7% | 10.0% |
| Standard Deviation (Sample) | 8.4% | 9.4% |
| Standard Deviation (Population) | 8.3% | 9.3% |
Similar Demographics by College, Under 1 year
Demographics Similar to Guyanese by College, Under 1 year
In terms of college, under 1 year, the demographic groups most similar to Guyanese are Central American Indian (59.0%, a difference of 0.040%), Immigrants from Grenada (59.1%, a difference of 0.080%), Immigrants from Belize (59.1%, a difference of 0.19%), Seminole (59.1%, a difference of 0.21%), and Nicaraguan (59.2%, a difference of 0.39%).
| Demographics | Rating | Rank | College, Under 1 year |
| Ecuadorians | 0.0 /100 | #290 | Tragic 59.3% |
| Creek | 0.0 /100 | #291 | Tragic 59.3% |
| Nicaraguans | 0.0 /100 | #292 | Tragic 59.2% |
| Seminole | 0.0 /100 | #293 | Tragic 59.1% |
| Immigrants | Belize | 0.0 /100 | #294 | Tragic 59.1% |
| Immigrants | Grenada | 0.0 /100 | #295 | Tragic 59.1% |
| Central American Indians | 0.0 /100 | #296 | Tragic 59.0% |
| Guyanese | 0.0 /100 | #297 | Tragic 59.0% |
| Immigrants | Ecuador | 0.0 /100 | #298 | Tragic 58.7% |
| Cubans | 0.0 /100 | #299 | Tragic 58.6% |
| Immigrants | Guyana | 0.0 /100 | #300 | Tragic 58.5% |
| Mexican American Indians | 0.0 /100 | #301 | Tragic 58.1% |
| Apache | 0.0 /100 | #302 | Tragic 58.0% |
| Immigrants | Dominica | 0.0 /100 | #303 | Tragic 57.9% |
| Kiowa | 0.0 /100 | #304 | Tragic 57.8% |
Demographics Similar to Chileans by College, Under 1 year
In terms of college, under 1 year, the demographic groups most similar to Chileans are Basque (67.6%, a difference of 0.010%), Syrian (67.6%, a difference of 0.080%), Immigrants from Nepal (67.5%, a difference of 0.090%), Macedonian (67.6%, a difference of 0.10%), and Pakistani (67.5%, a difference of 0.11%).
| Demographics | Rating | Rank | College, Under 1 year |
| Austrians | 96.4 /100 | #107 | Exceptional 67.8% |
| Immigrants | Egypt | 96.0 /100 | #108 | Exceptional 67.7% |
| Scandinavians | 95.8 /100 | #109 | Exceptional 67.7% |
| Assyrians/Chaldeans/Syriacs | 95.8 /100 | #110 | Exceptional 67.7% |
| Ukrainians | 95.8 /100 | #111 | Exceptional 67.7% |
| Macedonians | 95.7 /100 | #112 | Exceptional 67.6% |
| Syrians | 95.6 /100 | #113 | Exceptional 67.6% |
| Chileans | 95.3 /100 | #114 | Exceptional 67.6% |
| Basques | 95.2 /100 | #115 | Exceptional 67.6% |
| Immigrants | Nepal | 94.9 /100 | #116 | Exceptional 67.5% |
| Pakistanis | 94.8 /100 | #117 | Exceptional 67.5% |
| Immigrants | Ukraine | 94.7 /100 | #118 | Exceptional 67.5% |
| Lebanese | 94.6 /100 | #119 | Exceptional 67.5% |
| Serbians | 93.9 /100 | #120 | Exceptional 67.4% |
| Slovenes | 93.3 /100 | #121 | Exceptional 67.3% |