Immigrants from Cambodia vs Chilean College, Under 1 year
COMPARE
Immigrants from Cambodia
Chilean
College, Under 1 year
College, Under 1 year Comparison
Immigrants from Cambodia
Chileans
61.5%
COLLEGE, UNDER 1 YEAR
0.4/ 100
METRIC RATING
254th/ 347
METRIC RANK
67.6%
COLLEGE, UNDER 1 YEAR
95.3/ 100
METRIC RATING
114th/ 347
METRIC RANK
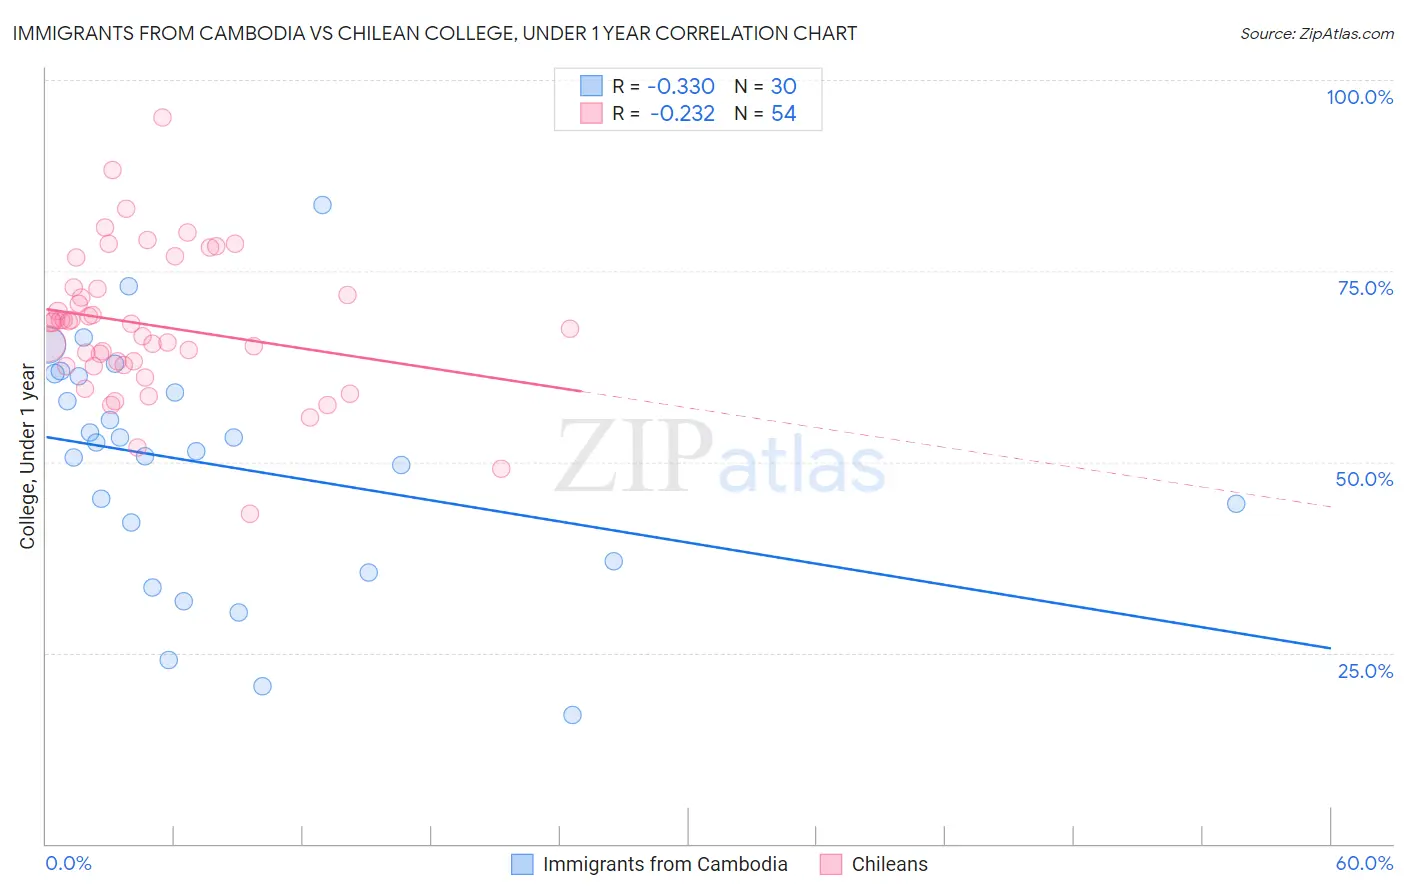
Immigrants from Cambodia vs Chilean College, Under 1 year Correlation Chart
The statistical analysis conducted on geographies consisting of 205,153,442 people shows a mild negative correlation between the proportion of Immigrants from Cambodia and percentage of population with at least college, under 1 year education in the United States with a correlation coefficient (R) of -0.330 and weighted average of 61.5%. Similarly, the statistical analysis conducted on geographies consisting of 256,681,764 people shows a weak negative correlation between the proportion of Chileans and percentage of population with at least college, under 1 year education in the United States with a correlation coefficient (R) of -0.232 and weighted average of 67.6%, a difference of 9.9%.
College, Under 1 year Correlation Summary
| Measurement | Immigrants from Cambodia | Chilean |
| Minimum | 16.8% | 43.2% |
| Maximum | 83.7% | 95.0% |
| Range | 66.8% | 51.9% |
| Mean | 49.5% | 67.9% |
| Median | 52.0% | 68.2% |
| Interquartile 25% (IQ1) | 36.9% | 62.7% |
| Interquartile 75% (IQ3) | 61.3% | 72.6% |
| Interquartile Range (IQR) | 24.4% | 10.0% |
| Standard Deviation (Sample) | 15.6% | 9.4% |
| Standard Deviation (Population) | 15.3% | 9.3% |
Similar Demographics by College, Under 1 year
Demographics Similar to Immigrants from Cambodia by College, Under 1 year
In terms of college, under 1 year, the demographic groups most similar to Immigrants from Cambodia are West Indian (61.5%, a difference of 0.0%), Japanese (61.5%, a difference of 0.0%), Immigrants from Micronesia (61.5%, a difference of 0.11%), Comanche (61.4%, a difference of 0.12%), and Bangladeshi (61.4%, a difference of 0.17%).
| Demographics | Rating | Rank | College, Under 1 year |
| Immigrants | Liberia | 0.8 /100 | #247 | Tragic 61.9% |
| Potawatomi | 0.6 /100 | #248 | Tragic 61.8% |
| Vietnamese | 0.5 /100 | #249 | Tragic 61.7% |
| Immigrants | Congo | 0.5 /100 | #250 | Tragic 61.7% |
| Immigrants | Micronesia | 0.5 /100 | #251 | Tragic 61.5% |
| West Indians | 0.4 /100 | #252 | Tragic 61.5% |
| Japanese | 0.4 /100 | #253 | Tragic 61.5% |
| Immigrants | Cambodia | 0.4 /100 | #254 | Tragic 61.5% |
| Comanche | 0.4 /100 | #255 | Tragic 61.4% |
| Bangladeshis | 0.4 /100 | #256 | Tragic 61.4% |
| Immigrants | Laos | 0.3 /100 | #257 | Tragic 61.3% |
| Immigrants | Bangladesh | 0.3 /100 | #258 | Tragic 61.3% |
| Indonesians | 0.3 /100 | #259 | Tragic 61.2% |
| Blackfeet | 0.3 /100 | #260 | Tragic 61.1% |
| Africans | 0.3 /100 | #261 | Tragic 61.1% |
Demographics Similar to Chileans by College, Under 1 year
In terms of college, under 1 year, the demographic groups most similar to Chileans are Basque (67.6%, a difference of 0.010%), Syrian (67.6%, a difference of 0.080%), Immigrants from Nepal (67.5%, a difference of 0.090%), Macedonian (67.6%, a difference of 0.10%), and Pakistani (67.5%, a difference of 0.11%).
| Demographics | Rating | Rank | College, Under 1 year |
| Austrians | 96.4 /100 | #107 | Exceptional 67.8% |
| Immigrants | Egypt | 96.0 /100 | #108 | Exceptional 67.7% |
| Scandinavians | 95.8 /100 | #109 | Exceptional 67.7% |
| Assyrians/Chaldeans/Syriacs | 95.8 /100 | #110 | Exceptional 67.7% |
| Ukrainians | 95.8 /100 | #111 | Exceptional 67.7% |
| Macedonians | 95.7 /100 | #112 | Exceptional 67.6% |
| Syrians | 95.6 /100 | #113 | Exceptional 67.6% |
| Chileans | 95.3 /100 | #114 | Exceptional 67.6% |
| Basques | 95.2 /100 | #115 | Exceptional 67.6% |
| Immigrants | Nepal | 94.9 /100 | #116 | Exceptional 67.5% |
| Pakistanis | 94.8 /100 | #117 | Exceptional 67.5% |
| Immigrants | Ukraine | 94.7 /100 | #118 | Exceptional 67.5% |
| Lebanese | 94.6 /100 | #119 | Exceptional 67.5% |
| Serbians | 93.9 /100 | #120 | Exceptional 67.4% |
| Slovenes | 93.3 /100 | #121 | Exceptional 67.3% |