Immigrants from Laos vs Vietnamese College, Under 1 year

COMPARE

Immigrants from Laos
Race
Ancestry
AfghanAfricanAlaska NativeAlaskan AthabascanAlbanianAleutAlsatianAmericanApacheArabArapahoArgentineanArmenianAssyrian/Chaldean/SyriacAustralianAustrianBahamianBangladeshiBarbadianBasqueBelgianBelizeanBermudanBhutaneseBlackfeetBolivianBrazilianBritishBritish West IndianBulgarianBurmeseCajunCambodianCanadianCape VerdeanCarpatho RusynCelticCentral AmericanCentral American IndianCherokeeCheyenneChickasawChileanChineseChippewaChoctawColombianColvilleComancheCosta RicanCreeCreekCroatianCrowCubanCypriotCzechCzechoslovakianDanishDelawareDominicanDutchDutch West IndianEastern EuropeanEcuadorianEgyptianEnglishEstonianEthiopianEuropeanFijianFilipinoFinnishFrenchFrench American IndianFrench CanadianGermanGerman RussianGhanaianGreekGuamanian/ChamorroGuatemalanGuyaneseHaitianHmongHonduranHopiHoumaHungarianIcelanderIndian (Asian)IndonesianInupiatIranianIraqiIrishIroquoisIsraeliItalianJamaicanJapaneseJordanianKenyanKiowaKoreanLaotianLatvianLebaneseLiberianLithuanianLumbeeLuxembourgerMacedonianMalaysianMalteseMarshalleseMenomineeMexicanMexican American IndianMongolianMoroccanNative HawaiianNavajoNepaleseNew ZealanderNicaraguanNigerianNorthern EuropeanNorwegianOkinawanOsageOttawaPaiutePakistaniPalestinianPanamanianParaguayanPennsylvania GermanPeruvianPimaPolishPortuguesePotawatomiPuebloPuerto RicanPuget Sound SalishRomanianRussianSalvadoranSamoanScandinavianScotch-IrishScottishSeminoleSenegaleseSerbianShoshoneSierra LeoneanSiouxSlavicSlovakSloveneSomaliSouth AfricanSouth AmericanSouth American IndianSoviet UnionSpaniardSpanishSpanish AmericanSpanish American IndianSri LankanSubsaharan AfricanSudaneseSwedishSwissSyrianTaiwaneseThaiTlingit-HaidaTohono O'OdhamTonganTrinidadian and TobagonianTsimshianTurkishU.S. Virgin IslanderUgandanUkrainianUruguayanUteVenezuelanWelshWest IndianYakamaYaquiYugoslavianYumanYup'ikZimbabwean
Immigration
NonimmigrantsImmigrantsAfghanistanAfricaAlbaniaArgentinaArmeniaAsiaAustraliaAustriaBahamasBangladeshBarbadosBelarusBelgiumBelizeBoliviaBosnia and HerzegovinaBrazilBulgariaBurma/MyanmarCabo VerdeCambodiaCameroonCanadaCaribbeanCentral AmericaChileChinaColombiaCongoCosta RicaCroatiaCubaCzechoslovakiaDenmarkDominicaDominican RepublicEastern AfricaEastern AsiaEastern EuropeEcuadorEgyptEl SalvadorEnglandEritreaEthiopiaEuropeFijiFranceGermanyGhanaGreeceGrenadaGuatemalaGuyanaHaitiHondurasHong KongHungaryIndiaIndonesiaIranIraqIrelandIsraelItalyJamaicaJapanJordanKazakhstanKenyaKoreaKuwaitLaosLatin AmericaLatviaLebanonLiberiaLithuaniaMalaysiaMexicoMicronesiaMiddle AfricaMoldovaMoroccoNepalNetherlandsNicaraguaNigeriaNorth AmericaNorth MacedoniaNorthern AfricaNorthern EuropeNorwayOceaniaPakistanPanamaPeruPhilippinesPolandPortugalRomaniaRussiaSaudi ArabiaScotlandSenegalSerbiaSierra LeoneSingaporeSomaliaSouth AfricaSouth AmericaSouth Central AsiaSouth Eastern AsiaSouthern EuropeSpainSri LankaSt. Vincent and the GrenadinesSudanSwedenSwitzerlandSyriaTaiwanThailandTrinidad and TobagoTurkeyUgandaUkraineUruguayUzbekistanVenezuelaVietnamWest IndiesWestern AfricaWestern AsiaWestern EuropeYemenZaireZimbabweAzores
Vietnamese
Race
Ancestry
AfghanAfricanAlaska NativeAlaskan AthabascanAlbanianAleutAlsatianAmericanApacheArabArapahoArgentineanArmenianAssyrian/Chaldean/SyriacAustralianAustrianBahamianBangladeshiBarbadianBasqueBelgianBelizeanBermudanBhutaneseBlackfeetBolivianBrazilianBritishBritish West IndianBulgarianBurmeseCajunCambodianCanadianCape VerdeanCarpatho RusynCelticCentral AmericanCentral American IndianCherokeeCheyenneChickasawChileanChineseChippewaChoctawColombianColvilleComancheCosta RicanCreeCreekCroatianCrowCubanCypriotCzechCzechoslovakianDanishDelawareDominicanDutchDutch West IndianEastern EuropeanEcuadorianEgyptianEnglishEstonianEthiopianEuropeanFijianFilipinoFinnishFrenchFrench American IndianFrench CanadianGermanGerman RussianGhanaianGreekGuamanian/ChamorroGuatemalanGuyaneseHaitianHmongHonduranHopiHoumaHungarianIcelanderIndian (Asian)IndonesianInupiatIranianIraqiIrishIroquoisIsraeliItalianJamaicanJapaneseJordanianKenyanKiowaKoreanLaotianLatvianLebaneseLiberianLithuanianLumbeeLuxembourgerMacedonianMalaysianMalteseMarshalleseMenomineeMexicanMexican American IndianMongolianMoroccanNative HawaiianNavajoNepaleseNew ZealanderNicaraguanNigerianNorthern EuropeanNorwegianOkinawanOsageOttawaPaiutePakistaniPalestinianPanamanianParaguayanPennsylvania GermanPeruvianPimaPolishPortuguesePotawatomiPuebloPuerto RicanPuget Sound SalishRomanianRussianSalvadoranSamoanScandinavianScotch-IrishScottishSeminoleSenegaleseSerbianShoshoneSierra LeoneanSiouxSlavicSlovakSloveneSomaliSouth AfricanSouth AmericanSouth American IndianSoviet UnionSpaniardSpanishSpanish AmericanSpanish American IndianSri LankanSubsaharan AfricanSudaneseSwedishSwissSyrianTaiwaneseThaiTlingit-HaidaTohono O'OdhamTonganTrinidadian and TobagonianTsimshianTurkishU.S. Virgin IslanderUgandanUkrainianUruguayanUteVenezuelanVietnameseWelshWest IndianYakamaYaquiYugoslavianYumanYup'ikZimbabwean
Immigration
NonimmigrantsImmigrantsAfghanistanAfricaAlbaniaArgentinaArmeniaAsiaAustraliaAustriaBahamasBangladeshBarbadosBelarusBelgiumBelizeBoliviaBosnia and HerzegovinaBrazilBulgariaBurma/MyanmarCabo VerdeCambodiaCameroonCanadaCaribbeanCentral AmericaChileChinaColombiaCongoCosta RicaCroatiaCubaCzechoslovakiaDenmarkDominicaDominican RepublicEastern AfricaEastern AsiaEastern EuropeEcuadorEgyptEl SalvadorEnglandEritreaEthiopiaEuropeFijiFranceGermanyGhanaGreeceGrenadaGuatemalaGuyanaHaitiHondurasHong KongHungaryIndiaIndonesiaIranIraqIrelandIsraelItalyJamaicaJapanJordanKazakhstanKenyaKoreaKuwaitLatin AmericaLatviaLebanonLiberiaLithuaniaMalaysiaMexicoMicronesiaMiddle AfricaMoldovaMoroccoNepalNetherlandsNicaraguaNigeriaNorth AmericaNorth MacedoniaNorthern AfricaNorthern EuropeNorwayOceaniaPakistanPanamaPeruPhilippinesPolandPortugalRomaniaRussiaSaudi ArabiaScotlandSenegalSerbiaSierra LeoneSingaporeSomaliaSouth AfricaSouth AmericaSouth Central AsiaSouth Eastern AsiaSouthern EuropeSpainSri LankaSt. Vincent and the GrenadinesSudanSwedenSwitzerlandSyriaTaiwanThailandTrinidad and TobagoTurkeyUgandaUkraineUruguayUzbekistanVenezuelaVietnamWest IndiesWestern AfricaWestern AsiaWestern EuropeYemenZaireZimbabweAzores
College, Under 1 year
Income
Poverty
Unemployment
Labor Participation
Family Structure
Vehicle Availability
Education Level
Disability

College, Under 1 year Comparison

Immigrants from Laos

Vietnamese

Tragic
Tragic
61.3%
COLLEGE, UNDER 1 YEAR
0.3/ 100
METRIC RATING
257th/ 347
METRIC RANK
61.7%
COLLEGE, UNDER 1 YEAR
0.5/ 100
METRIC RATING
249th/ 347
METRIC RANK

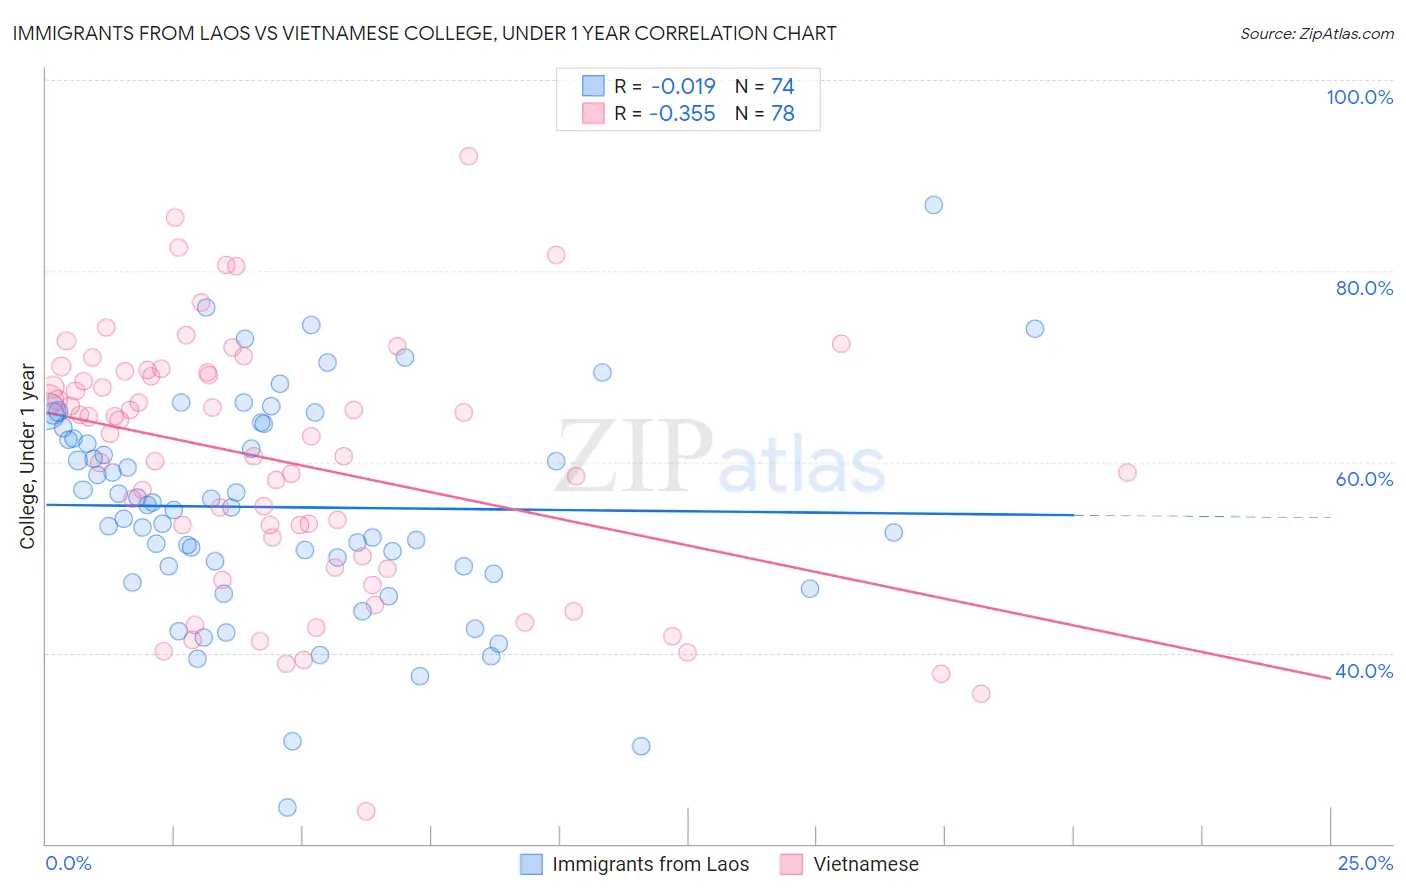
Immigrants from Laos vs Vietnamese College, Under 1 year Correlation Chart

The statistical analysis conducted on geographies consisting of 201,475,732 people shows no correlation between the proportion of Immigrants from Laos and percentage of population with at least college, under 1 year education in the United States with a correlation coefficient (R) of -0.019 and weighted average of 61.3%. Similarly, the statistical analysis conducted on geographies consisting of 170,751,543 people shows a mild negative correlation between the proportion of Vietnamese and percentage of population with at least college, under 1 year education in the United States with a correlation coefficient (R) of -0.355 and weighted average of 61.7%, a difference of 0.58%.
Immigrants from Laos vs Vietnamese College, Under 1 year

College, Under 1 year Correlation Summary

MeasurementImmigrants from LaosVietnamese
Minimum23.8%23.5%
Maximum86.9%92.0%
Range63.2%68.6%
Mean55.2%60.1%
Median55.3%62.8%
Interquartile 25% (IQ1)49.0%50.1%
Interquartile 75% (IQ3)63.6%69.4%
Interquartile Range (IQR)14.5%19.3%
Standard Deviation (Sample)11.4%13.4%
Standard Deviation (Population)11.4%13.3%

Demographics Similar to Immigrants from Laos and Vietnamese by College, Under 1 year

In terms of college, under 1 year, the demographic groups most similar to Immigrants from Laos are Immigrants from Bangladesh (61.3%, a difference of 0.060%), Indonesian (61.2%, a difference of 0.080%), Bangladeshi (61.4%, a difference of 0.11%), Comanche (61.4%, a difference of 0.16%), and Blackfeet (61.1%, a difference of 0.25%). Similarly, the demographic groups most similar to Vietnamese are Immigrants from Congo (61.7%, a difference of 0.0%), Potawatomi (61.8%, a difference of 0.16%), Immigrants from Micronesia (61.5%, a difference of 0.19%), West Indian (61.5%, a difference of 0.30%), and Japanese (61.5%, a difference of 0.30%).
DemographicsRating | RankCollege, Under 1 year
Hawaiians
1.1
/100
|
#243
Tragic
62.1%
Colville
1.0
/100
|
#244
Tragic
62.1%
Delaware
0.9
/100
|
#245
Tragic
62.1%
Marshallese
0.8
/100
|
#246
Tragic
61.9%
Immigrants | Liberia
0.8
/100
|
#247
Tragic
61.9%
Potawatomi
0.6
/100
|
#248
Tragic
61.8%
Vietnamese
0.5
/100
|
#249
Tragic
61.7%
Immigrants | Congo
0.5
/100
|
#250
Tragic
61.7%
Immigrants | Micronesia
0.5
/100
|
#251
Tragic
61.5%
West Indians
0.4
/100
|
#252
Tragic
61.5%
Japanese
0.4
/100
|
#253
Tragic
61.5%
Immigrants | Cambodia
0.4
/100
|
#254
Tragic
61.5%
Comanche
0.4
/100
|
#255
Tragic
61.4%
Bangladeshis
0.4
/100
|
#256
Tragic
61.4%
Immigrants | Laos
0.3
/100
|
#257
Tragic
61.3%
Immigrants | Bangladesh
0.3
/100
|
#258
Tragic
61.3%
Indonesians
0.3
/100
|
#259
Tragic
61.2%
Blackfeet
0.3
/100
|
#260
Tragic
61.1%
Africans
0.3
/100
|
#261
Tragic
61.1%
Barbadians
0.2
/100
|
#262
Tragic
61.1%
Shoshone
0.2
/100
|
#263
Tragic
61.1%