Immigrants from Laos vs Chilean Median Family Income
COMPARE
Immigrants from Laos
Chilean
Median Family Income
Median Family Income Comparison
Immigrants from Laos
Chileans
$92,239
MEDIAN FAMILY INCOME
0.5/ 100
METRIC RATING
255th/ 347
METRIC RANK
$108,429
MEDIAN FAMILY INCOME
95.0/ 100
METRIC RATING
116th/ 347
METRIC RANK
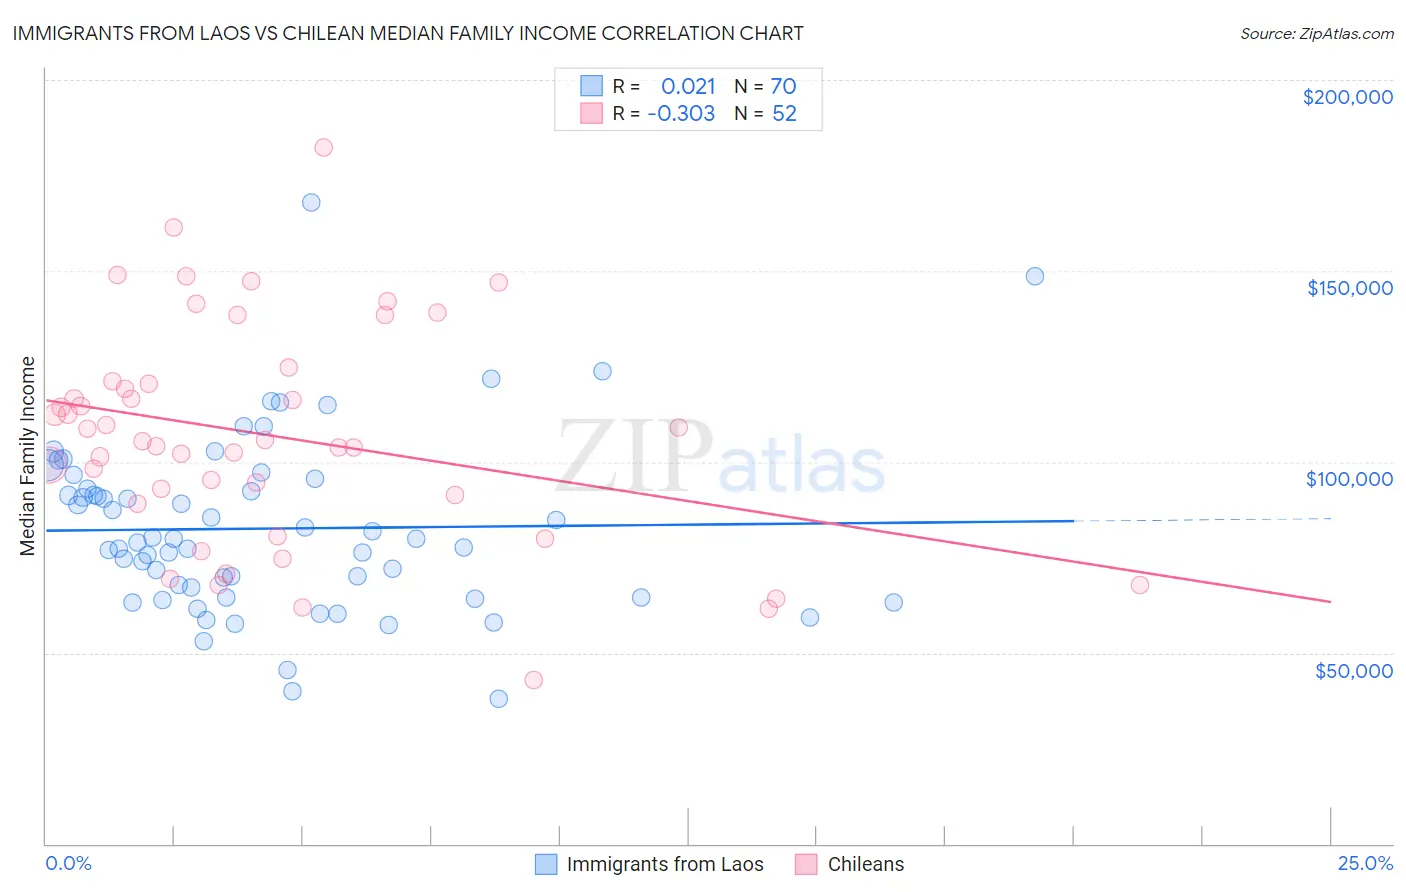
Immigrants from Laos vs Chilean Median Family Income Correlation Chart
The statistical analysis conducted on geographies consisting of 201,460,525 people shows no correlation between the proportion of Immigrants from Laos and median family income in the United States with a correlation coefficient (R) of 0.021 and weighted average of $92,239. Similarly, the statistical analysis conducted on geographies consisting of 256,482,123 people shows a mild negative correlation between the proportion of Chileans and median family income in the United States with a correlation coefficient (R) of -0.303 and weighted average of $108,429, a difference of 17.5%.
Median Family Income Correlation Summary
| Measurement | Immigrants from Laos | Chilean |
| Minimum | $38,021 | $42,833 |
| Maximum | $167,827 | $182,212 |
| Range | $129,806 | $139,379 |
| Mean | $82,539 | $106,873 |
| Median | $79,366 | $105,526 |
| Interquartile 25% (IQ1) | $64,523 | $90,247 |
| Interquartile 75% (IQ3) | $93,010 | $120,874 |
| Interquartile Range (IQR) | $28,486 | $30,627 |
| Standard Deviation (Sample) | $23,089 | $28,929 |
| Standard Deviation (Population) | $22,924 | $28,649 |
Similar Demographics by Median Family Income
Demographics Similar to Immigrants from Laos by Median Family Income
In terms of median family income, the demographic groups most similar to Immigrants from Laos are Nicaraguan ($92,231, a difference of 0.010%), American ($92,096, a difference of 0.16%), Immigrants from Barbados ($92,419, a difference of 0.20%), Immigrants from Guyana ($92,513, a difference of 0.30%), and Immigrants from El Salvador ($92,545, a difference of 0.33%).
| Demographics | Rating | Rank | Median Family Income |
| French American Indians | 0.7 /100 | #248 | Tragic $92,872 |
| Immigrants | Ecuador | 0.7 /100 | #249 | Tragic $92,837 |
| West Indians | 0.6 /100 | #250 | Tragic $92,765 |
| Immigrants | Somalia | 0.6 /100 | #251 | Tragic $92,609 |
| Immigrants | El Salvador | 0.6 /100 | #252 | Tragic $92,545 |
| Immigrants | Guyana | 0.6 /100 | #253 | Tragic $92,513 |
| Immigrants | Barbados | 0.5 /100 | #254 | Tragic $92,419 |
| Immigrants | Laos | 0.5 /100 | #255 | Tragic $92,239 |
| Nicaraguans | 0.5 /100 | #256 | Tragic $92,231 |
| Americans | 0.4 /100 | #257 | Tragic $92,096 |
| Osage | 0.4 /100 | #258 | Tragic $91,926 |
| Cape Verdeans | 0.4 /100 | #259 | Tragic $91,848 |
| Pennsylvania Germans | 0.4 /100 | #260 | Tragic $91,763 |
| Inupiat | 0.4 /100 | #261 | Tragic $91,730 |
| Liberians | 0.4 /100 | #262 | Tragic $91,722 |
Demographics Similar to Chileans by Median Family Income
In terms of median family income, the demographic groups most similar to Chileans are Swedish ($108,499, a difference of 0.060%), Polish ($108,507, a difference of 0.070%), Immigrants from Saudi Arabia ($108,544, a difference of 0.11%), Immigrants from Poland ($108,570, a difference of 0.13%), and Immigrants from Philippines ($108,288, a difference of 0.13%).
| Demographics | Rating | Rank | Median Family Income |
| Immigrants | Afghanistan | 95.6 /100 | #109 | Exceptional $108,709 |
| British | 95.6 /100 | #110 | Exceptional $108,705 |
| Immigrants | Western Asia | 95.6 /100 | #111 | Exceptional $108,691 |
| Immigrants | Poland | 95.3 /100 | #112 | Exceptional $108,570 |
| Immigrants | Saudi Arabia | 95.2 /100 | #113 | Exceptional $108,544 |
| Poles | 95.2 /100 | #114 | Exceptional $108,507 |
| Swedes | 95.1 /100 | #115 | Exceptional $108,499 |
| Chileans | 95.0 /100 | #116 | Exceptional $108,429 |
| Immigrants | Philippines | 94.6 /100 | #117 | Exceptional $108,288 |
| Ethiopians | 94.5 /100 | #118 | Exceptional $108,251 |
| Sri Lankans | 94.5 /100 | #119 | Exceptional $108,234 |
| Immigrants | Northern Africa | 94.3 /100 | #120 | Exceptional $108,161 |
| Europeans | 94.1 /100 | #121 | Exceptional $108,099 |
| Immigrants | Jordan | 92.9 /100 | #122 | Exceptional $107,715 |
| Carpatho Rusyns | 92.2 /100 | #123 | Exceptional $107,502 |