Immigrants from Western Asia vs Chilean College, Under 1 year
COMPARE
Immigrants from Western Asia
Chilean
College, Under 1 year
College, Under 1 year Comparison
Immigrants from Western Asia
Chileans
67.8%
COLLEGE, UNDER 1 YEAR
96.6/ 100
METRIC RATING
104th/ 347
METRIC RANK
67.6%
COLLEGE, UNDER 1 YEAR
95.3/ 100
METRIC RATING
114th/ 347
METRIC RANK
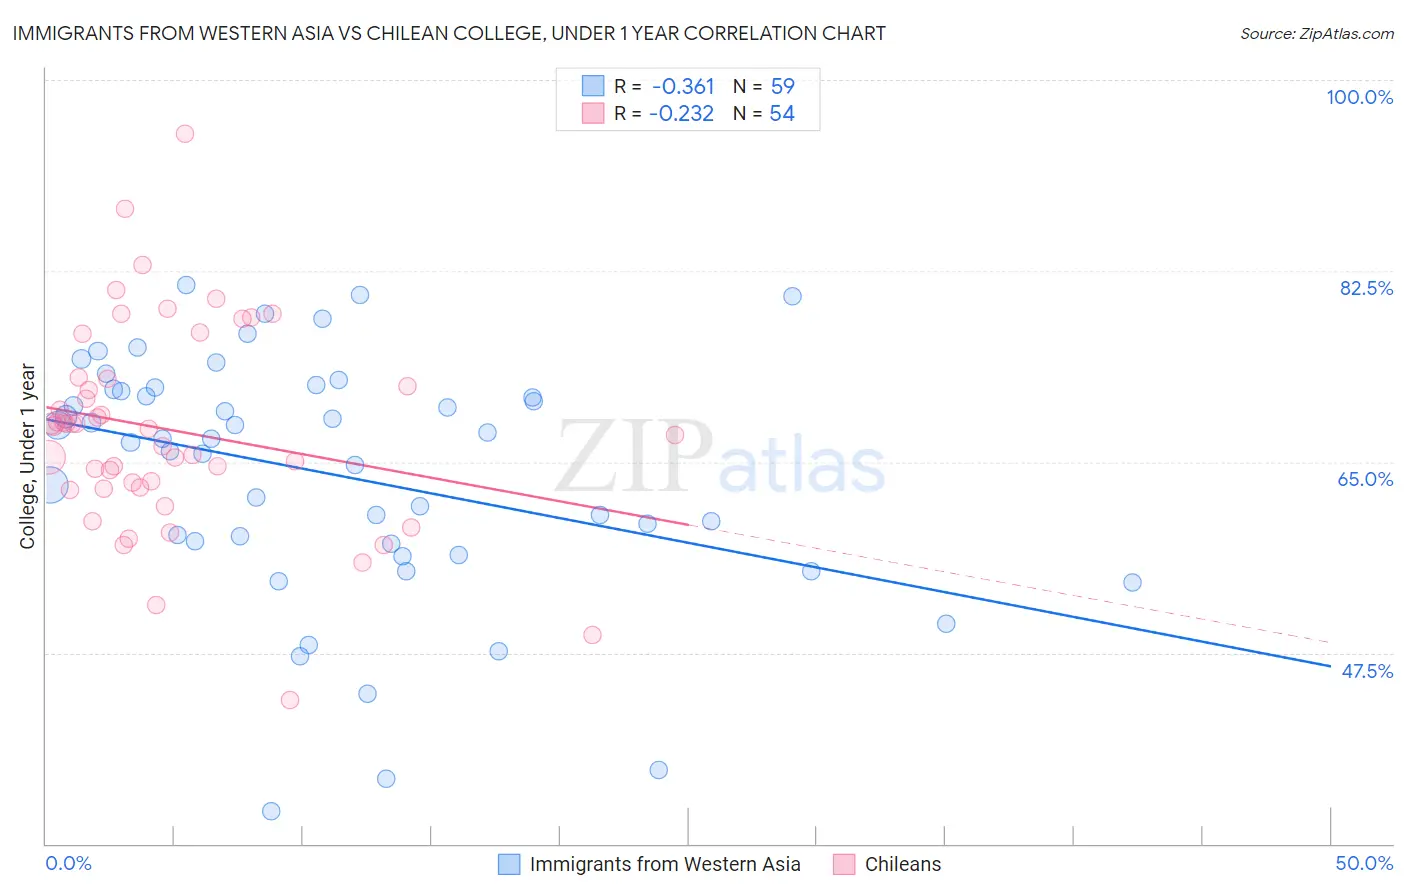
Immigrants from Western Asia vs Chilean College, Under 1 year Correlation Chart
The statistical analysis conducted on geographies consisting of 404,433,725 people shows a mild negative correlation between the proportion of Immigrants from Western Asia and percentage of population with at least college, under 1 year education in the United States with a correlation coefficient (R) of -0.361 and weighted average of 67.8%. Similarly, the statistical analysis conducted on geographies consisting of 256,681,764 people shows a weak negative correlation between the proportion of Chileans and percentage of population with at least college, under 1 year education in the United States with a correlation coefficient (R) of -0.232 and weighted average of 67.6%, a difference of 0.37%.
College, Under 1 year Correlation Summary
| Measurement | Immigrants from Western Asia | Chilean |
| Minimum | 33.0% | 43.2% |
| Maximum | 81.2% | 95.0% |
| Range | 48.2% | 51.9% |
| Mean | 63.9% | 67.9% |
| Median | 67.1% | 68.2% |
| Interquartile 25% (IQ1) | 57.5% | 62.7% |
| Interquartile 75% (IQ3) | 71.6% | 72.6% |
| Interquartile Range (IQR) | 14.2% | 10.0% |
| Standard Deviation (Sample) | 11.2% | 9.4% |
| Standard Deviation (Population) | 11.1% | 9.3% |
Demographics Similar to Immigrants from Western Asia and Chileans by College, Under 1 year
In terms of college, under 1 year, the demographic groups most similar to Immigrants from Western Asia are Afghan (67.8%, a difference of 0.0%), Immigrants from Croatia (67.8%, a difference of 0.010%), Carpatho Rusyn (67.9%, a difference of 0.070%), Austrian (67.8%, a difference of 0.070%), and Immigrants from Eastern Europe (67.9%, a difference of 0.080%). Similarly, the demographic groups most similar to Chileans are Basque (67.6%, a difference of 0.010%), Syrian (67.6%, a difference of 0.080%), Immigrants from Nepal (67.5%, a difference of 0.090%), Macedonian (67.6%, a difference of 0.10%), and Pakistani (67.5%, a difference of 0.11%).
| Demographics | Rating | Rank | College, Under 1 year |
| Immigrants | Bolivia | 97.0 /100 | #99 | Exceptional 67.9% |
| Immigrants | Argentina | 97.0 /100 | #100 | Exceptional 67.9% |
| Immigrants | Eastern Europe | 96.9 /100 | #101 | Exceptional 67.9% |
| Palestinians | 96.9 /100 | #102 | Exceptional 67.9% |
| Carpatho Rusyns | 96.8 /100 | #103 | Exceptional 67.9% |
| Immigrants | Western Asia | 96.6 /100 | #104 | Exceptional 67.8% |
| Afghans | 96.6 /100 | #105 | Exceptional 67.8% |
| Immigrants | Croatia | 96.6 /100 | #106 | Exceptional 67.8% |
| Austrians | 96.4 /100 | #107 | Exceptional 67.8% |
| Immigrants | Egypt | 96.0 /100 | #108 | Exceptional 67.7% |
| Scandinavians | 95.8 /100 | #109 | Exceptional 67.7% |
| Assyrians/Chaldeans/Syriacs | 95.8 /100 | #110 | Exceptional 67.7% |
| Ukrainians | 95.8 /100 | #111 | Exceptional 67.7% |
| Macedonians | 95.7 /100 | #112 | Exceptional 67.6% |
| Syrians | 95.6 /100 | #113 | Exceptional 67.6% |
| Chileans | 95.3 /100 | #114 | Exceptional 67.6% |
| Basques | 95.2 /100 | #115 | Exceptional 67.6% |
| Immigrants | Nepal | 94.9 /100 | #116 | Exceptional 67.5% |
| Pakistanis | 94.8 /100 | #117 | Exceptional 67.5% |
| Immigrants | Ukraine | 94.7 /100 | #118 | Exceptional 67.5% |
| Lebanese | 94.6 /100 | #119 | Exceptional 67.5% |