Immigrants from Laos vs Chilean Unemployment
COMPARE
Immigrants from Laos
Chilean
Unemployment
Unemployment Comparison
Immigrants from Laos
Chileans
5.3%
UNEMPLOYMENT
30.9/ 100
METRIC RATING
194th/ 347
METRIC RANK
5.0%
UNEMPLOYMENT
93.2/ 100
METRIC RATING
111th/ 347
METRIC RANK
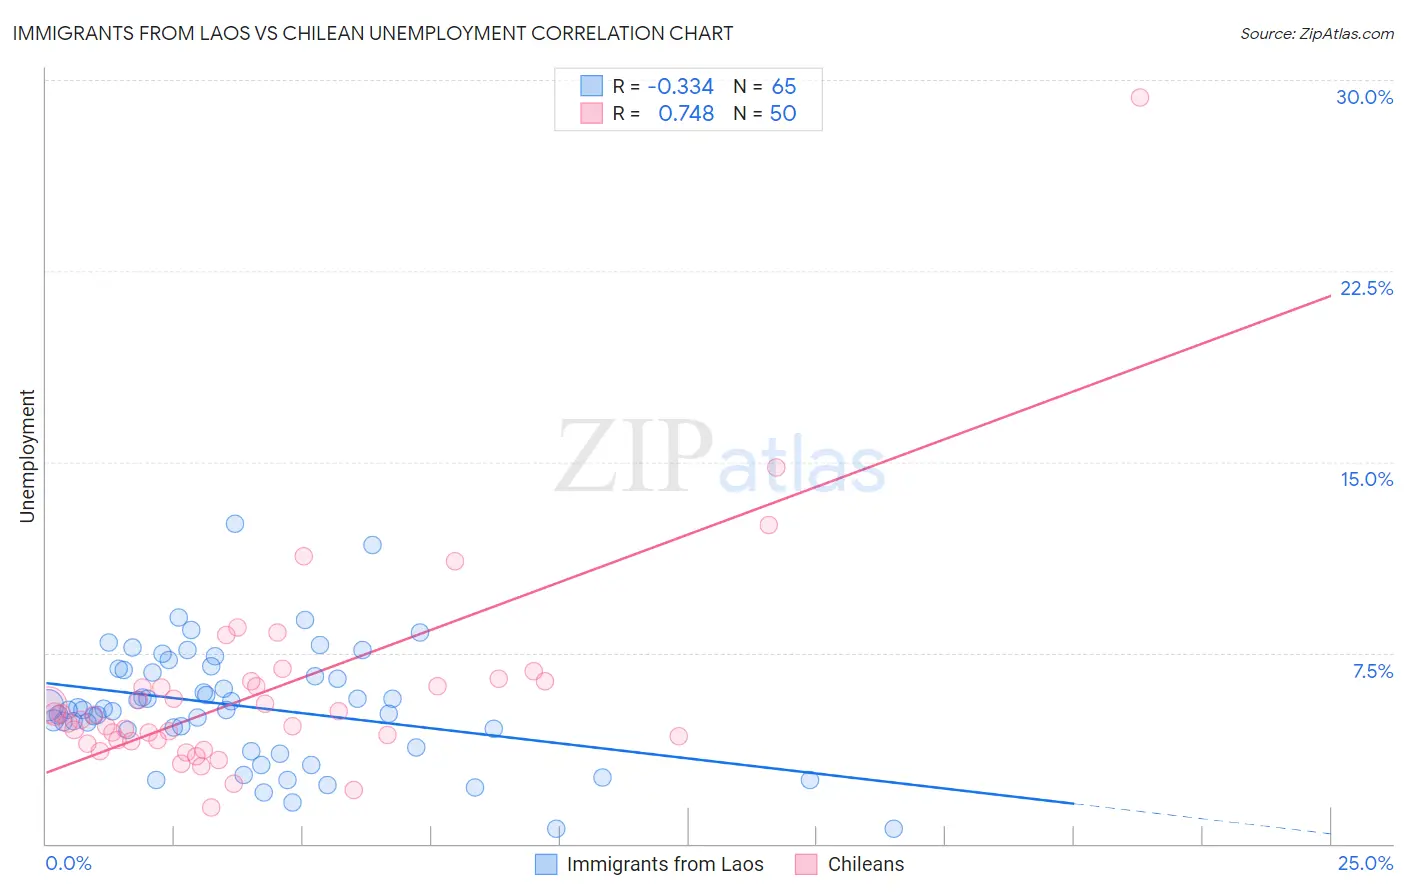
Immigrants from Laos vs Chilean Unemployment Correlation Chart
The statistical analysis conducted on geographies consisting of 201,374,148 people shows a mild negative correlation between the proportion of Immigrants from Laos and unemployment in the United States with a correlation coefficient (R) of -0.334 and weighted average of 5.3%. Similarly, the statistical analysis conducted on geographies consisting of 256,557,466 people shows a strong positive correlation between the proportion of Chileans and unemployment in the United States with a correlation coefficient (R) of 0.748 and weighted average of 5.0%, a difference of 5.5%.
Unemployment Correlation Summary
| Measurement | Immigrants from Laos | Chilean |
| Minimum | 0.60% | 1.4% |
| Maximum | 12.6% | 29.3% |
| Range | 12.0% | 27.9% |
| Mean | 5.4% | 6.0% |
| Median | 5.3% | 5.0% |
| Interquartile 25% (IQ1) | 4.1% | 4.1% |
| Interquartile 75% (IQ3) | 6.9% | 6.4% |
| Interquartile Range (IQR) | 2.7% | 2.3% |
| Standard Deviation (Sample) | 2.3% | 4.2% |
| Standard Deviation (Population) | 2.3% | 4.2% |
Similar Demographics by Unemployment
Demographics Similar to Immigrants from Laos by Unemployment
In terms of unemployment, the demographic groups most similar to Immigrants from Laos are Immigrants from Southern Europe (5.3%, a difference of 0.0%), Peruvian (5.3%, a difference of 0.080%), Immigrants from Uruguay (5.3%, a difference of 0.080%), Immigrants from Israel (5.3%, a difference of 0.17%), and Immigrants from Afghanistan (5.3%, a difference of 0.17%).
| Demographics | Rating | Rank | Unemployment |
| Costa Ricans | 37.4 /100 | #187 | Fair 5.3% |
| Alsatians | 37.0 /100 | #188 | Fair 5.3% |
| Immigrants | Belarus | 35.6 /100 | #189 | Fair 5.3% |
| Arabs | 35.3 /100 | #190 | Fair 5.3% |
| Somalis | 34.0 /100 | #191 | Fair 5.3% |
| South Americans | 33.9 /100 | #192 | Fair 5.3% |
| Immigrants | Somalia | 33.8 /100 | #193 | Fair 5.3% |
| Immigrants | Laos | 30.9 /100 | #194 | Fair 5.3% |
| Immigrants | Southern Europe | 30.9 /100 | #195 | Fair 5.3% |
| Peruvians | 29.9 /100 | #196 | Fair 5.3% |
| Immigrants | Uruguay | 29.8 /100 | #197 | Fair 5.3% |
| Immigrants | Israel | 28.6 /100 | #198 | Fair 5.3% |
| Immigrants | Afghanistan | 28.6 /100 | #199 | Fair 5.3% |
| Koreans | 27.4 /100 | #200 | Fair 5.3% |
| Immigrants | South Eastern Asia | 27.0 /100 | #201 | Fair 5.3% |
Demographics Similar to Chileans by Unemployment
In terms of unemployment, the demographic groups most similar to Chileans are Immigrants from Lithuania (5.0%, a difference of 0.0%), Immigrants from Eritrea (5.0%, a difference of 0.020%), Immigrants from Kuwait (5.0%, a difference of 0.12%), Immigrants from Turkey (5.0%, a difference of 0.13%), and Immigrants from Romania (5.0%, a difference of 0.14%).
| Demographics | Rating | Rank | Unemployment |
| Osage | 94.0 /100 | #104 | Exceptional 5.0% |
| Maltese | 94.0 /100 | #105 | Exceptional 5.0% |
| Immigrants | Romania | 93.7 /100 | #106 | Exceptional 5.0% |
| Immigrants | Turkey | 93.7 /100 | #107 | Exceptional 5.0% |
| Immigrants | Kuwait | 93.7 /100 | #108 | Exceptional 5.0% |
| Immigrants | Eritrea | 93.3 /100 | #109 | Exceptional 5.0% |
| Immigrants | Lithuania | 93.2 /100 | #110 | Exceptional 5.0% |
| Chileans | 93.2 /100 | #111 | Exceptional 5.0% |
| South Africans | 92.6 /100 | #112 | Exceptional 5.1% |
| Argentineans | 92.4 /100 | #113 | Exceptional 5.1% |
| Immigrants | Ireland | 92.1 /100 | #114 | Exceptional 5.1% |
| Immigrants | Western Europe | 91.1 /100 | #115 | Exceptional 5.1% |
| Immigrants | Sri Lanka | 91.1 /100 | #116 | Exceptional 5.1% |
| Immigrants | Malaysia | 91.0 /100 | #117 | Exceptional 5.1% |
| Immigrants | Germany | 90.8 /100 | #118 | Exceptional 5.1% |