Immigrants from Laos vs Serbian College, Under 1 year
COMPARE
Immigrants from Laos
Serbian
College, Under 1 year
College, Under 1 year Comparison
Immigrants from Laos
Serbians
61.3%
COLLEGE, UNDER 1 YEAR
0.3/ 100
METRIC RATING
257th/ 347
METRIC RANK
67.4%
COLLEGE, UNDER 1 YEAR
93.9/ 100
METRIC RATING
120th/ 347
METRIC RANK
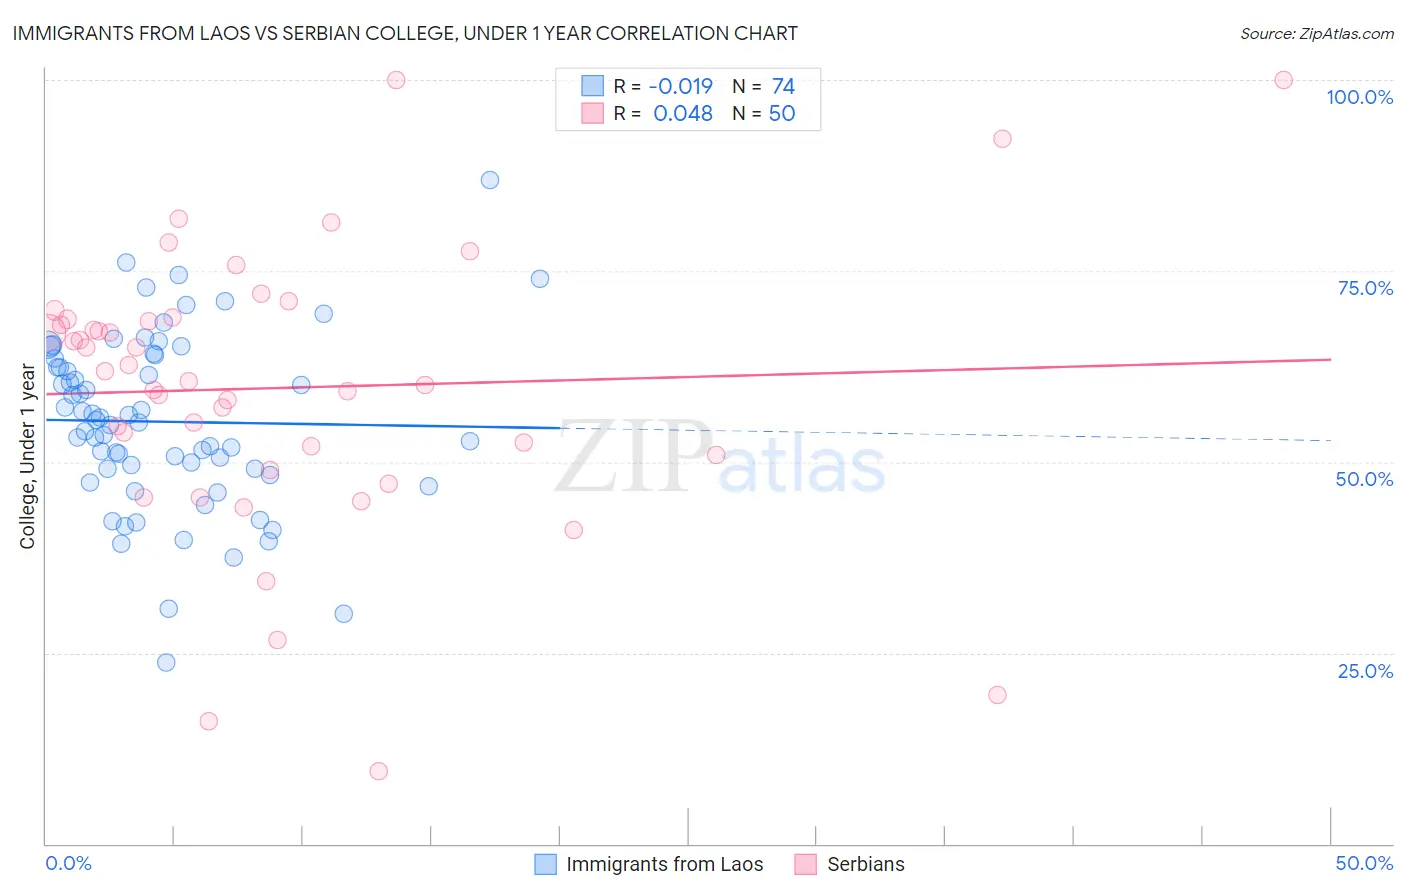
Immigrants from Laos vs Serbian College, Under 1 year Correlation Chart
The statistical analysis conducted on geographies consisting of 201,475,732 people shows no correlation between the proportion of Immigrants from Laos and percentage of population with at least college, under 1 year education in the United States with a correlation coefficient (R) of -0.019 and weighted average of 61.3%. Similarly, the statistical analysis conducted on geographies consisting of 267,640,905 people shows no correlation between the proportion of Serbians and percentage of population with at least college, under 1 year education in the United States with a correlation coefficient (R) of 0.048 and weighted average of 67.4%, a difference of 9.9%.
College, Under 1 year Correlation Summary
| Measurement | Immigrants from Laos | Serbian |
| Minimum | 23.8% | 9.5% |
| Maximum | 86.9% | 100.0% |
| Range | 63.2% | 90.5% |
| Mean | 55.2% | 59.7% |
| Median | 55.3% | 61.2% |
| Interquartile 25% (IQ1) | 49.0% | 50.9% |
| Interquartile 75% (IQ3) | 63.6% | 68.7% |
| Interquartile Range (IQR) | 14.5% | 17.7% |
| Standard Deviation (Sample) | 11.4% | 18.5% |
| Standard Deviation (Population) | 11.4% | 18.3% |
Similar Demographics by College, Under 1 year
Demographics Similar to Immigrants from Laos by College, Under 1 year
In terms of college, under 1 year, the demographic groups most similar to Immigrants from Laos are Immigrants from Bangladesh (61.3%, a difference of 0.060%), Indonesian (61.2%, a difference of 0.080%), Bangladeshi (61.4%, a difference of 0.11%), Comanche (61.4%, a difference of 0.16%), and Blackfeet (61.1%, a difference of 0.25%).
| Demographics | Rating | Rank | College, Under 1 year |
| Immigrants | Congo | 0.5 /100 | #250 | Tragic 61.7% |
| Immigrants | Micronesia | 0.5 /100 | #251 | Tragic 61.5% |
| West Indians | 0.4 /100 | #252 | Tragic 61.5% |
| Japanese | 0.4 /100 | #253 | Tragic 61.5% |
| Immigrants | Cambodia | 0.4 /100 | #254 | Tragic 61.5% |
| Comanche | 0.4 /100 | #255 | Tragic 61.4% |
| Bangladeshis | 0.4 /100 | #256 | Tragic 61.4% |
| Immigrants | Laos | 0.3 /100 | #257 | Tragic 61.3% |
| Immigrants | Bangladesh | 0.3 /100 | #258 | Tragic 61.3% |
| Indonesians | 0.3 /100 | #259 | Tragic 61.2% |
| Blackfeet | 0.3 /100 | #260 | Tragic 61.1% |
| Africans | 0.3 /100 | #261 | Tragic 61.1% |
| Barbadians | 0.2 /100 | #262 | Tragic 61.1% |
| Shoshone | 0.2 /100 | #263 | Tragic 61.1% |
| Trinidadians and Tobagonians | 0.2 /100 | #264 | Tragic 61.1% |
Demographics Similar to Serbians by College, Under 1 year
In terms of college, under 1 year, the demographic groups most similar to Serbians are Slovene (67.3%, a difference of 0.10%), Lebanese (67.5%, a difference of 0.15%), Immigrants from Ukraine (67.5%, a difference of 0.16%), Pakistani (67.5%, a difference of 0.18%), and Immigrants from Jordan (67.3%, a difference of 0.18%).
| Demographics | Rating | Rank | College, Under 1 year |
| Syrians | 95.6 /100 | #113 | Exceptional 67.6% |
| Chileans | 95.3 /100 | #114 | Exceptional 67.6% |
| Basques | 95.2 /100 | #115 | Exceptional 67.6% |
| Immigrants | Nepal | 94.9 /100 | #116 | Exceptional 67.5% |
| Pakistanis | 94.8 /100 | #117 | Exceptional 67.5% |
| Immigrants | Ukraine | 94.7 /100 | #118 | Exceptional 67.5% |
| Lebanese | 94.6 /100 | #119 | Exceptional 67.5% |
| Serbians | 93.9 /100 | #120 | Exceptional 67.4% |
| Slovenes | 93.3 /100 | #121 | Exceptional 67.3% |
| Immigrants | Jordan | 92.8 /100 | #122 | Exceptional 67.3% |
| Immigrants | Northern Africa | 92.7 /100 | #123 | Exceptional 67.2% |
| Arabs | 92.6 /100 | #124 | Exceptional 67.2% |
| Italians | 91.8 /100 | #125 | Exceptional 67.2% |
| Alsatians | 91.3 /100 | #126 | Exceptional 67.1% |
| Czechs | 90.8 /100 | #127 | Exceptional 67.1% |