Norwegian vs Chilean College, Under 1 year
COMPARE
Norwegian
Chilean
College, Under 1 year
College, Under 1 year Comparison
Norwegians
Chileans
68.4%
COLLEGE, UNDER 1 YEAR
98.4/ 100
METRIC RATING
82nd/ 347
METRIC RANK
67.6%
COLLEGE, UNDER 1 YEAR
95.3/ 100
METRIC RATING
114th/ 347
METRIC RANK
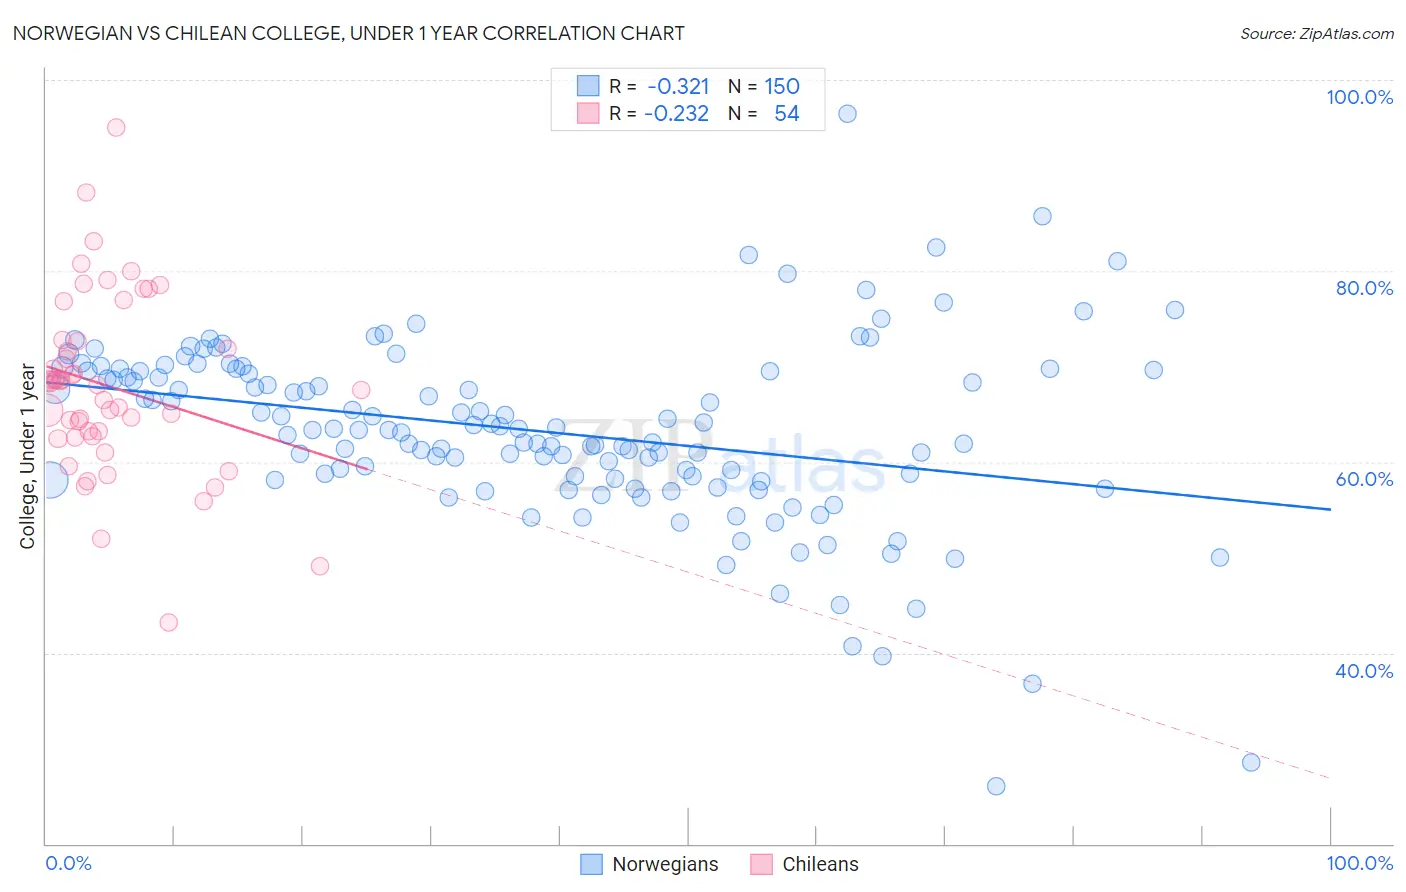
Norwegian vs Chilean College, Under 1 year Correlation Chart
The statistical analysis conducted on geographies consisting of 533,391,768 people shows a mild negative correlation between the proportion of Norwegians and percentage of population with at least college, under 1 year education in the United States with a correlation coefficient (R) of -0.321 and weighted average of 68.4%. Similarly, the statistical analysis conducted on geographies consisting of 256,681,764 people shows a weak negative correlation between the proportion of Chileans and percentage of population with at least college, under 1 year education in the United States with a correlation coefficient (R) of -0.232 and weighted average of 67.6%, a difference of 1.2%.
College, Under 1 year Correlation Summary
| Measurement | Norwegian | Chilean |
| Minimum | 26.1% | 43.2% |
| Maximum | 96.4% | 95.0% |
| Range | 70.3% | 51.9% |
| Mean | 63.2% | 67.9% |
| Median | 63.4% | 68.2% |
| Interquartile 25% (IQ1) | 58.2% | 62.7% |
| Interquartile 75% (IQ3) | 69.6% | 72.6% |
| Interquartile Range (IQR) | 11.3% | 10.0% |
| Standard Deviation (Sample) | 9.7% | 9.4% |
| Standard Deviation (Population) | 9.7% | 9.3% |
Similar Demographics by College, Under 1 year
Demographics Similar to Norwegians by College, Under 1 year
In terms of college, under 1 year, the demographic groups most similar to Norwegians are Argentinean (68.4%, a difference of 0.020%), Immigrants from Hungary (68.3%, a difference of 0.040%), Egyptian (68.3%, a difference of 0.040%), Immigrants from Greece (68.4%, a difference of 0.050%), and Immigrants from Lebanon (68.3%, a difference of 0.050%).
| Demographics | Rating | Rank | College, Under 1 year |
| Immigrants | Western Europe | 98.6 /100 | #75 | Exceptional 68.5% |
| Laotians | 98.6 /100 | #76 | Exceptional 68.5% |
| British | 98.6 /100 | #77 | Exceptional 68.5% |
| Danes | 98.6 /100 | #78 | Exceptional 68.5% |
| Greeks | 98.6 /100 | #79 | Exceptional 68.5% |
| Immigrants | Spain | 98.5 /100 | #80 | Exceptional 68.4% |
| Immigrants | Greece | 98.5 /100 | #81 | Exceptional 68.4% |
| Norwegians | 98.4 /100 | #82 | Exceptional 68.4% |
| Argentineans | 98.4 /100 | #83 | Exceptional 68.4% |
| Immigrants | Hungary | 98.3 /100 | #84 | Exceptional 68.3% |
| Egyptians | 98.3 /100 | #85 | Exceptional 68.3% |
| Immigrants | Lebanon | 98.3 /100 | #86 | Exceptional 68.3% |
| Chinese | 98.3 /100 | #87 | Exceptional 68.3% |
| Croatians | 98.2 /100 | #88 | Exceptional 68.3% |
| Ethiopians | 98.2 /100 | #89 | Exceptional 68.3% |
Demographics Similar to Chileans by College, Under 1 year
In terms of college, under 1 year, the demographic groups most similar to Chileans are Basque (67.6%, a difference of 0.010%), Syrian (67.6%, a difference of 0.080%), Immigrants from Nepal (67.5%, a difference of 0.090%), Macedonian (67.6%, a difference of 0.10%), and Pakistani (67.5%, a difference of 0.11%).
| Demographics | Rating | Rank | College, Under 1 year |
| Austrians | 96.4 /100 | #107 | Exceptional 67.8% |
| Immigrants | Egypt | 96.0 /100 | #108 | Exceptional 67.7% |
| Scandinavians | 95.8 /100 | #109 | Exceptional 67.7% |
| Assyrians/Chaldeans/Syriacs | 95.8 /100 | #110 | Exceptional 67.7% |
| Ukrainians | 95.8 /100 | #111 | Exceptional 67.7% |
| Macedonians | 95.7 /100 | #112 | Exceptional 67.6% |
| Syrians | 95.6 /100 | #113 | Exceptional 67.6% |
| Chileans | 95.3 /100 | #114 | Exceptional 67.6% |
| Basques | 95.2 /100 | #115 | Exceptional 67.6% |
| Immigrants | Nepal | 94.9 /100 | #116 | Exceptional 67.5% |
| Pakistanis | 94.8 /100 | #117 | Exceptional 67.5% |
| Immigrants | Ukraine | 94.7 /100 | #118 | Exceptional 67.5% |
| Lebanese | 94.6 /100 | #119 | Exceptional 67.5% |
| Serbians | 93.9 /100 | #120 | Exceptional 67.4% |
| Slovenes | 93.3 /100 | #121 | Exceptional 67.3% |