Immigrants from Laos vs South American College, Under 1 year
COMPARE
Immigrants from Laos
South American
College, Under 1 year
College, Under 1 year Comparison
Immigrants from Laos
South Americans
61.3%
COLLEGE, UNDER 1 YEAR
0.3/ 100
METRIC RATING
257th/ 347
METRIC RANK
64.2%
COLLEGE, UNDER 1 YEAR
16.2/ 100
METRIC RATING
202nd/ 347
METRIC RANK
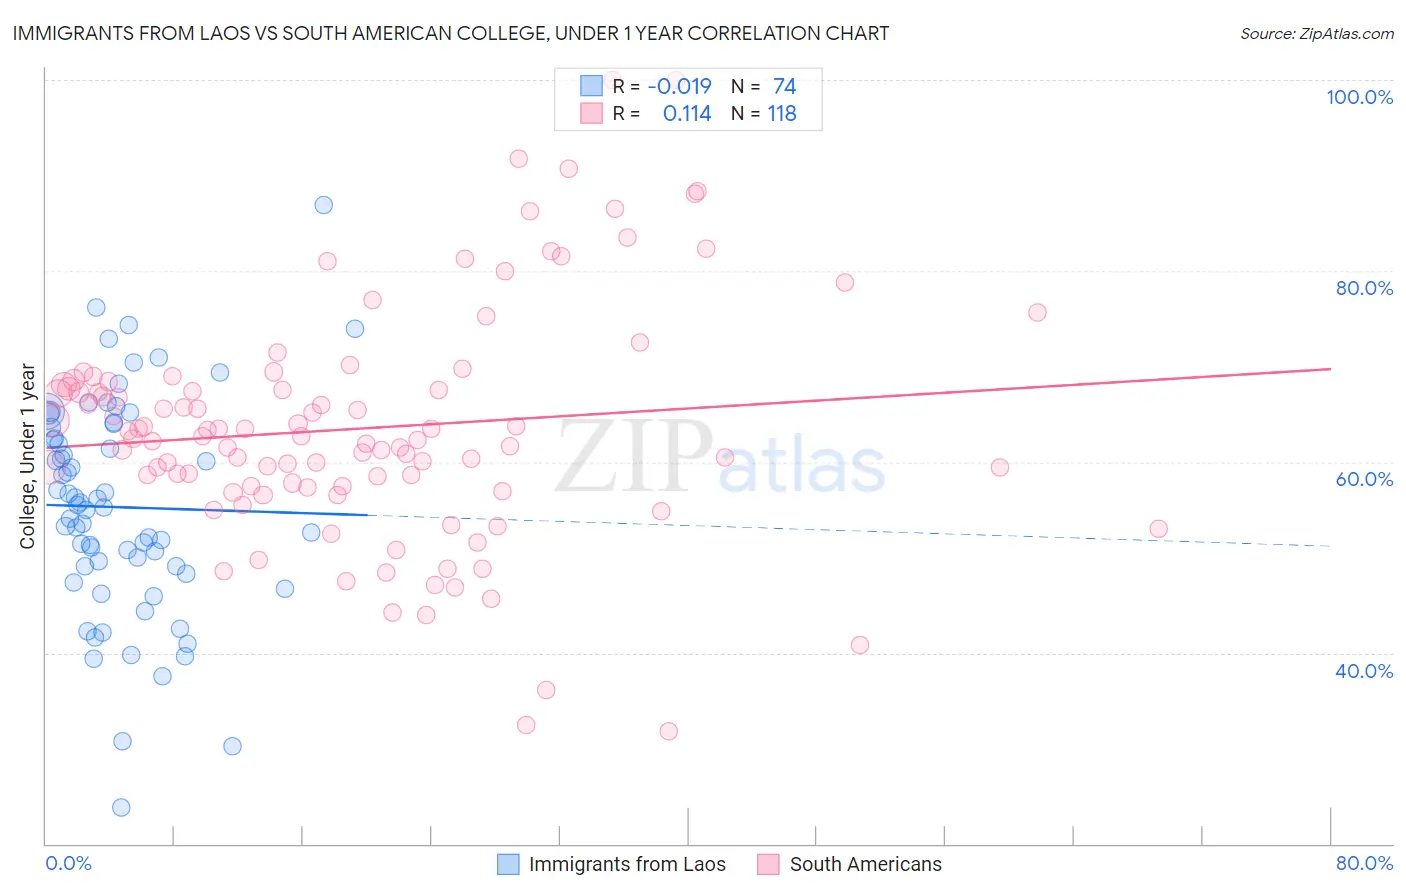
Immigrants from Laos vs South American College, Under 1 year Correlation Chart
The statistical analysis conducted on geographies consisting of 201,475,732 people shows no correlation between the proportion of Immigrants from Laos and percentage of population with at least college, under 1 year education in the United States with a correlation coefficient (R) of -0.019 and weighted average of 61.3%. Similarly, the statistical analysis conducted on geographies consisting of 494,173,553 people shows a poor positive correlation between the proportion of South Americans and percentage of population with at least college, under 1 year education in the United States with a correlation coefficient (R) of 0.114 and weighted average of 64.2%, a difference of 4.8%.
College, Under 1 year Correlation Summary
| Measurement | Immigrants from Laos | South American |
| Minimum | 23.8% | 31.8% |
| Maximum | 86.9% | 100.0% |
| Range | 63.2% | 68.2% |
| Mean | 55.2% | 63.5% |
| Median | 55.3% | 62.6% |
| Interquartile 25% (IQ1) | 49.0% | 57.4% |
| Interquartile 75% (IQ3) | 63.6% | 68.1% |
| Interquartile Range (IQR) | 14.5% | 10.7% |
| Standard Deviation (Sample) | 11.4% | 12.3% |
| Standard Deviation (Population) | 11.4% | 12.3% |
Similar Demographics by College, Under 1 year
Demographics Similar to Immigrants from Laos by College, Under 1 year
In terms of college, under 1 year, the demographic groups most similar to Immigrants from Laos are Immigrants from Bangladesh (61.3%, a difference of 0.060%), Indonesian (61.2%, a difference of 0.080%), Bangladeshi (61.4%, a difference of 0.11%), Comanche (61.4%, a difference of 0.16%), and Blackfeet (61.1%, a difference of 0.25%).
| Demographics | Rating | Rank | College, Under 1 year |
| Immigrants | Congo | 0.5 /100 | #250 | Tragic 61.7% |
| Immigrants | Micronesia | 0.5 /100 | #251 | Tragic 61.5% |
| West Indians | 0.4 /100 | #252 | Tragic 61.5% |
| Japanese | 0.4 /100 | #253 | Tragic 61.5% |
| Immigrants | Cambodia | 0.4 /100 | #254 | Tragic 61.5% |
| Comanche | 0.4 /100 | #255 | Tragic 61.4% |
| Bangladeshis | 0.4 /100 | #256 | Tragic 61.4% |
| Immigrants | Laos | 0.3 /100 | #257 | Tragic 61.3% |
| Immigrants | Bangladesh | 0.3 /100 | #258 | Tragic 61.3% |
| Indonesians | 0.3 /100 | #259 | Tragic 61.2% |
| Blackfeet | 0.3 /100 | #260 | Tragic 61.1% |
| Africans | 0.3 /100 | #261 | Tragic 61.1% |
| Barbadians | 0.2 /100 | #262 | Tragic 61.1% |
| Shoshone | 0.2 /100 | #263 | Tragic 61.1% |
| Trinidadians and Tobagonians | 0.2 /100 | #264 | Tragic 61.1% |
Demographics Similar to South Americans by College, Under 1 year
In terms of college, under 1 year, the demographic groups most similar to South Americans are French Canadian (64.2%, a difference of 0.010%), Nigerian (64.3%, a difference of 0.040%), Uruguayan (64.2%, a difference of 0.050%), Panamanian (64.3%, a difference of 0.070%), and Tsimshian (64.3%, a difference of 0.13%).
| Demographics | Rating | Rank | College, Under 1 year |
| Immigrants | South Eastern Asia | 22.1 /100 | #195 | Fair 64.5% |
| Tongans | 21.2 /100 | #196 | Fair 64.5% |
| Costa Ricans | 19.6 /100 | #197 | Poor 64.4% |
| Tsimshian | 17.9 /100 | #198 | Poor 64.3% |
| Panamanians | 17.0 /100 | #199 | Poor 64.3% |
| Nigerians | 16.7 /100 | #200 | Poor 64.3% |
| French Canadians | 16.3 /100 | #201 | Poor 64.2% |
| South Americans | 16.2 /100 | #202 | Poor 64.2% |
| Uruguayans | 15.6 /100 | #203 | Poor 64.2% |
| Immigrants | Zaire | 14.6 /100 | #204 | Poor 64.1% |
| Peruvians | 13.7 /100 | #205 | Poor 64.1% |
| Whites/Caucasians | 12.8 /100 | #206 | Poor 64.0% |
| Colombians | 12.4 /100 | #207 | Poor 64.0% |
| Immigrants | Vietnam | 12.1 /100 | #208 | Poor 64.0% |
| Puget Sound Salish | 11.3 /100 | #209 | Poor 63.9% |