Immigrants from Laos vs Peruvian College, Under 1 year
COMPARE
Immigrants from Laos
Peruvian
College, Under 1 year
College, Under 1 year Comparison
Immigrants from Laos
Peruvians
61.3%
COLLEGE, UNDER 1 YEAR
0.3/ 100
METRIC RATING
257th/ 347
METRIC RANK
64.1%
COLLEGE, UNDER 1 YEAR
13.7/ 100
METRIC RATING
205th/ 347
METRIC RANK
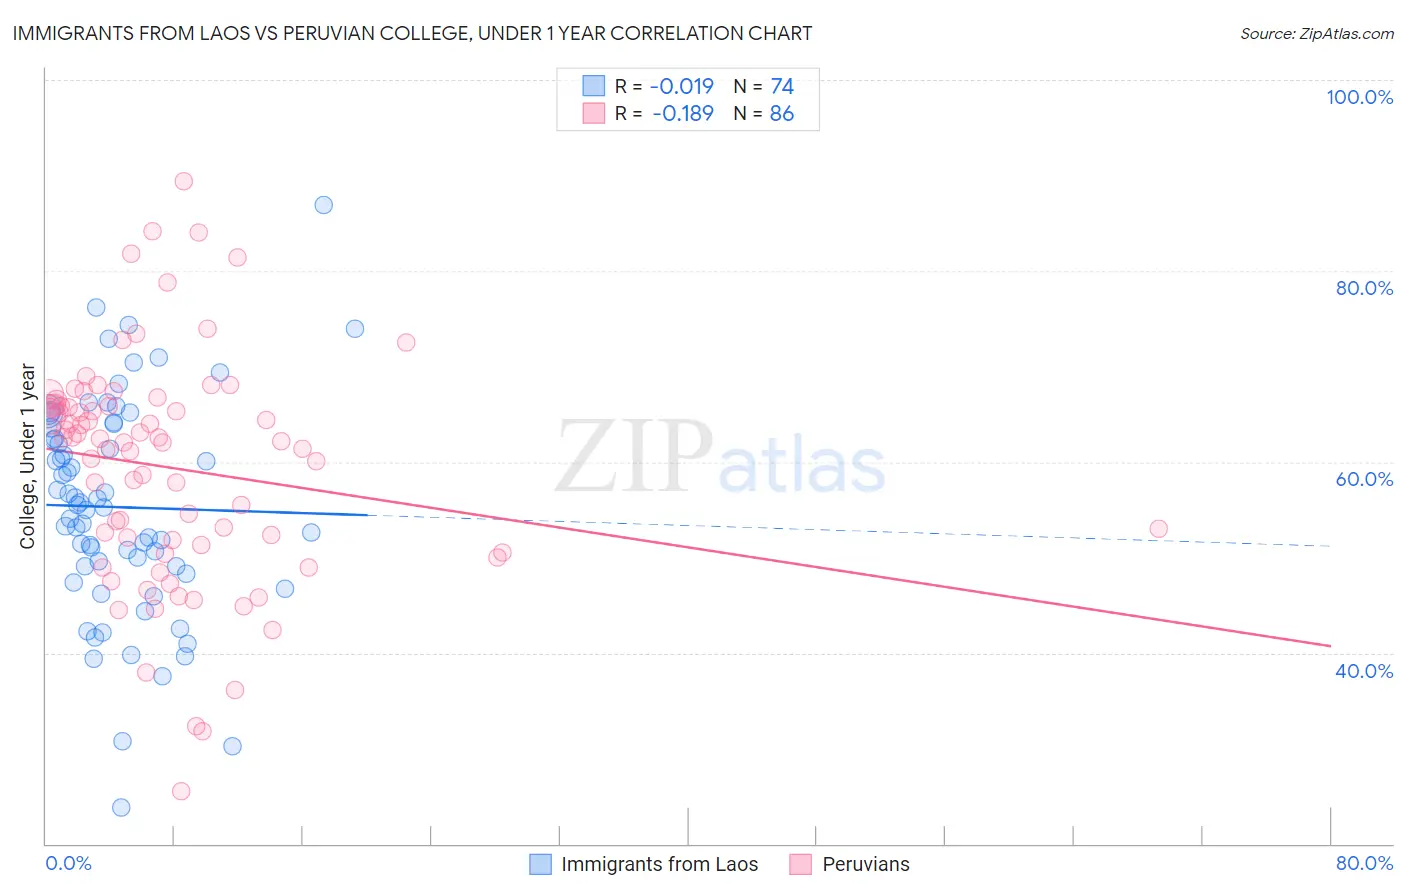
Immigrants from Laos vs Peruvian College, Under 1 year Correlation Chart
The statistical analysis conducted on geographies consisting of 201,475,732 people shows no correlation between the proportion of Immigrants from Laos and percentage of population with at least college, under 1 year education in the United States with a correlation coefficient (R) of -0.019 and weighted average of 61.3%. Similarly, the statistical analysis conducted on geographies consisting of 363,248,867 people shows a poor negative correlation between the proportion of Peruvians and percentage of population with at least college, under 1 year education in the United States with a correlation coefficient (R) of -0.189 and weighted average of 64.1%, a difference of 4.6%.
College, Under 1 year Correlation Summary
| Measurement | Immigrants from Laos | Peruvian |
| Minimum | 23.8% | 25.5% |
| Maximum | 86.9% | 89.4% |
| Range | 63.2% | 63.9% |
| Mean | 55.2% | 59.4% |
| Median | 55.3% | 62.1% |
| Interquartile 25% (IQ1) | 49.0% | 51.3% |
| Interquartile 75% (IQ3) | 63.6% | 65.9% |
| Interquartile Range (IQR) | 14.5% | 14.6% |
| Standard Deviation (Sample) | 11.4% | 12.0% |
| Standard Deviation (Population) | 11.4% | 11.9% |
Similar Demographics by College, Under 1 year
Demographics Similar to Immigrants from Laos by College, Under 1 year
In terms of college, under 1 year, the demographic groups most similar to Immigrants from Laos are Immigrants from Bangladesh (61.3%, a difference of 0.060%), Indonesian (61.2%, a difference of 0.080%), Bangladeshi (61.4%, a difference of 0.11%), Comanche (61.4%, a difference of 0.16%), and Blackfeet (61.1%, a difference of 0.25%).
| Demographics | Rating | Rank | College, Under 1 year |
| Immigrants | Congo | 0.5 /100 | #250 | Tragic 61.7% |
| Immigrants | Micronesia | 0.5 /100 | #251 | Tragic 61.5% |
| West Indians | 0.4 /100 | #252 | Tragic 61.5% |
| Japanese | 0.4 /100 | #253 | Tragic 61.5% |
| Immigrants | Cambodia | 0.4 /100 | #254 | Tragic 61.5% |
| Comanche | 0.4 /100 | #255 | Tragic 61.4% |
| Bangladeshis | 0.4 /100 | #256 | Tragic 61.4% |
| Immigrants | Laos | 0.3 /100 | #257 | Tragic 61.3% |
| Immigrants | Bangladesh | 0.3 /100 | #258 | Tragic 61.3% |
| Indonesians | 0.3 /100 | #259 | Tragic 61.2% |
| Blackfeet | 0.3 /100 | #260 | Tragic 61.1% |
| Africans | 0.3 /100 | #261 | Tragic 61.1% |
| Barbadians | 0.2 /100 | #262 | Tragic 61.1% |
| Shoshone | 0.2 /100 | #263 | Tragic 61.1% |
| Trinidadians and Tobagonians | 0.2 /100 | #264 | Tragic 61.1% |
Demographics Similar to Peruvians by College, Under 1 year
In terms of college, under 1 year, the demographic groups most similar to Peruvians are Immigrants from Zaire (64.1%, a difference of 0.080%), White/Caucasian (64.0%, a difference of 0.090%), Colombian (64.0%, a difference of 0.13%), Immigrants from Vietnam (64.0%, a difference of 0.16%), and Uruguayan (64.2%, a difference of 0.17%).
| Demographics | Rating | Rank | College, Under 1 year |
| Tsimshian | 17.9 /100 | #198 | Poor 64.3% |
| Panamanians | 17.0 /100 | #199 | Poor 64.3% |
| Nigerians | 16.7 /100 | #200 | Poor 64.3% |
| French Canadians | 16.3 /100 | #201 | Poor 64.2% |
| South Americans | 16.2 /100 | #202 | Poor 64.2% |
| Uruguayans | 15.6 /100 | #203 | Poor 64.2% |
| Immigrants | Zaire | 14.6 /100 | #204 | Poor 64.1% |
| Peruvians | 13.7 /100 | #205 | Poor 64.1% |
| Whites/Caucasians | 12.8 /100 | #206 | Poor 64.0% |
| Colombians | 12.4 /100 | #207 | Poor 64.0% |
| Immigrants | Vietnam | 12.1 /100 | #208 | Poor 64.0% |
| Puget Sound Salish | 11.3 /100 | #209 | Poor 63.9% |
| Ghanaians | 11.2 /100 | #210 | Poor 63.9% |
| Native Hawaiians | 10.6 /100 | #211 | Poor 63.9% |
| Immigrants | Middle Africa | 10.5 /100 | #212 | Poor 63.9% |